Market Overview: NASDAQ 100 Emini Futures
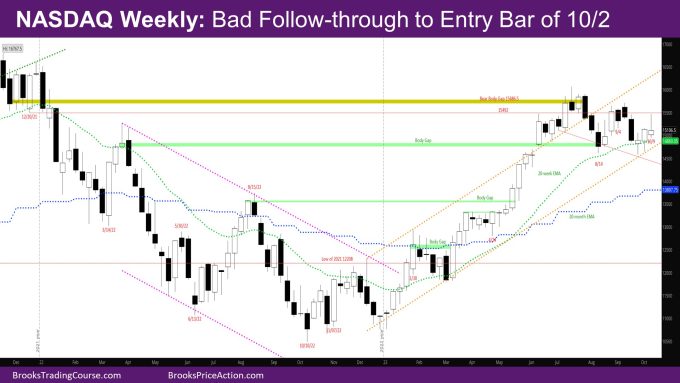
The NASDAQ Emini futures week is a doji bar with a small bull body and a big tail on top. It is a bad follow-through to entry bar of 10/2, closing below last week’s high.
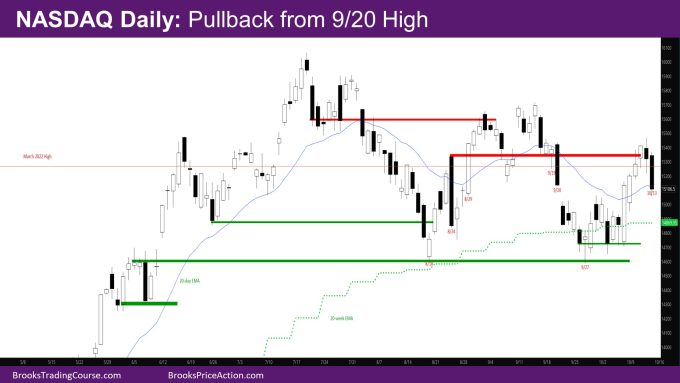
On the daily chart, this went up to the high of 9/20 and reversed from there.
The month so far is an inside bar with a tail above.
NASDAQ 100 Emini futures
The Weekly NASDAQ chart

- The week is doji bar with a small bull body and a big tail above.
- Bulls needed a good follow-through bar to confirm it is breaking out of the trading range reversal bar of two weeks ago.
- As mentioned in prior reports, there were likely sellers higher.
- The market went above the high of the big bear bar of 9/18 and reversed.
- There should be buyers below, the question is where do they come in?
- So, the market will likely test below this week to see where buyers come in. They should come in within the next bar or two.
- This is becuase bulls have been strong enough so far to prevent a close below the close of 8/14 – the low close of the 1st strong leg down.
- They have also prevented multiple bear closes below the bull body gap from March 2022.
- To call the bull gap effectively closed, bears need a couple of bear closes below that gap.
- If bulls can go up from here, the body gap close would be a considered a negative gap – a small overlap, but trend resumption up.
- It looks like the market is in a trading range between the bear body gap from November 2021 and the bull body gap from March 2022, both shown in the chart.
The Daily NASDAQ chart

- Friday is a strong bear trend bar closing right at the daily EMA from above.
- Last week’s report had mentioned that there are likely sellers near the high of 9/20 or the buy signal bar of 9/19 that triggered and then failed.
- The sellers did come around the high of 9/20 where the market reversed.
- The bulls got enough good bull bars on Monday-Wednesday in reaching the high of 9/20, that there should be another leg up.
- Bulls need to break above the high of 9/14 to not have lower highs.
- Given the bad bull bar on the weekly chart though, the next couple of weeks look sideways to down.
Market analysis reports archive
You can access all weekend reports on the Market Analysis page.

