Market Overview: FTSE 100 Futures
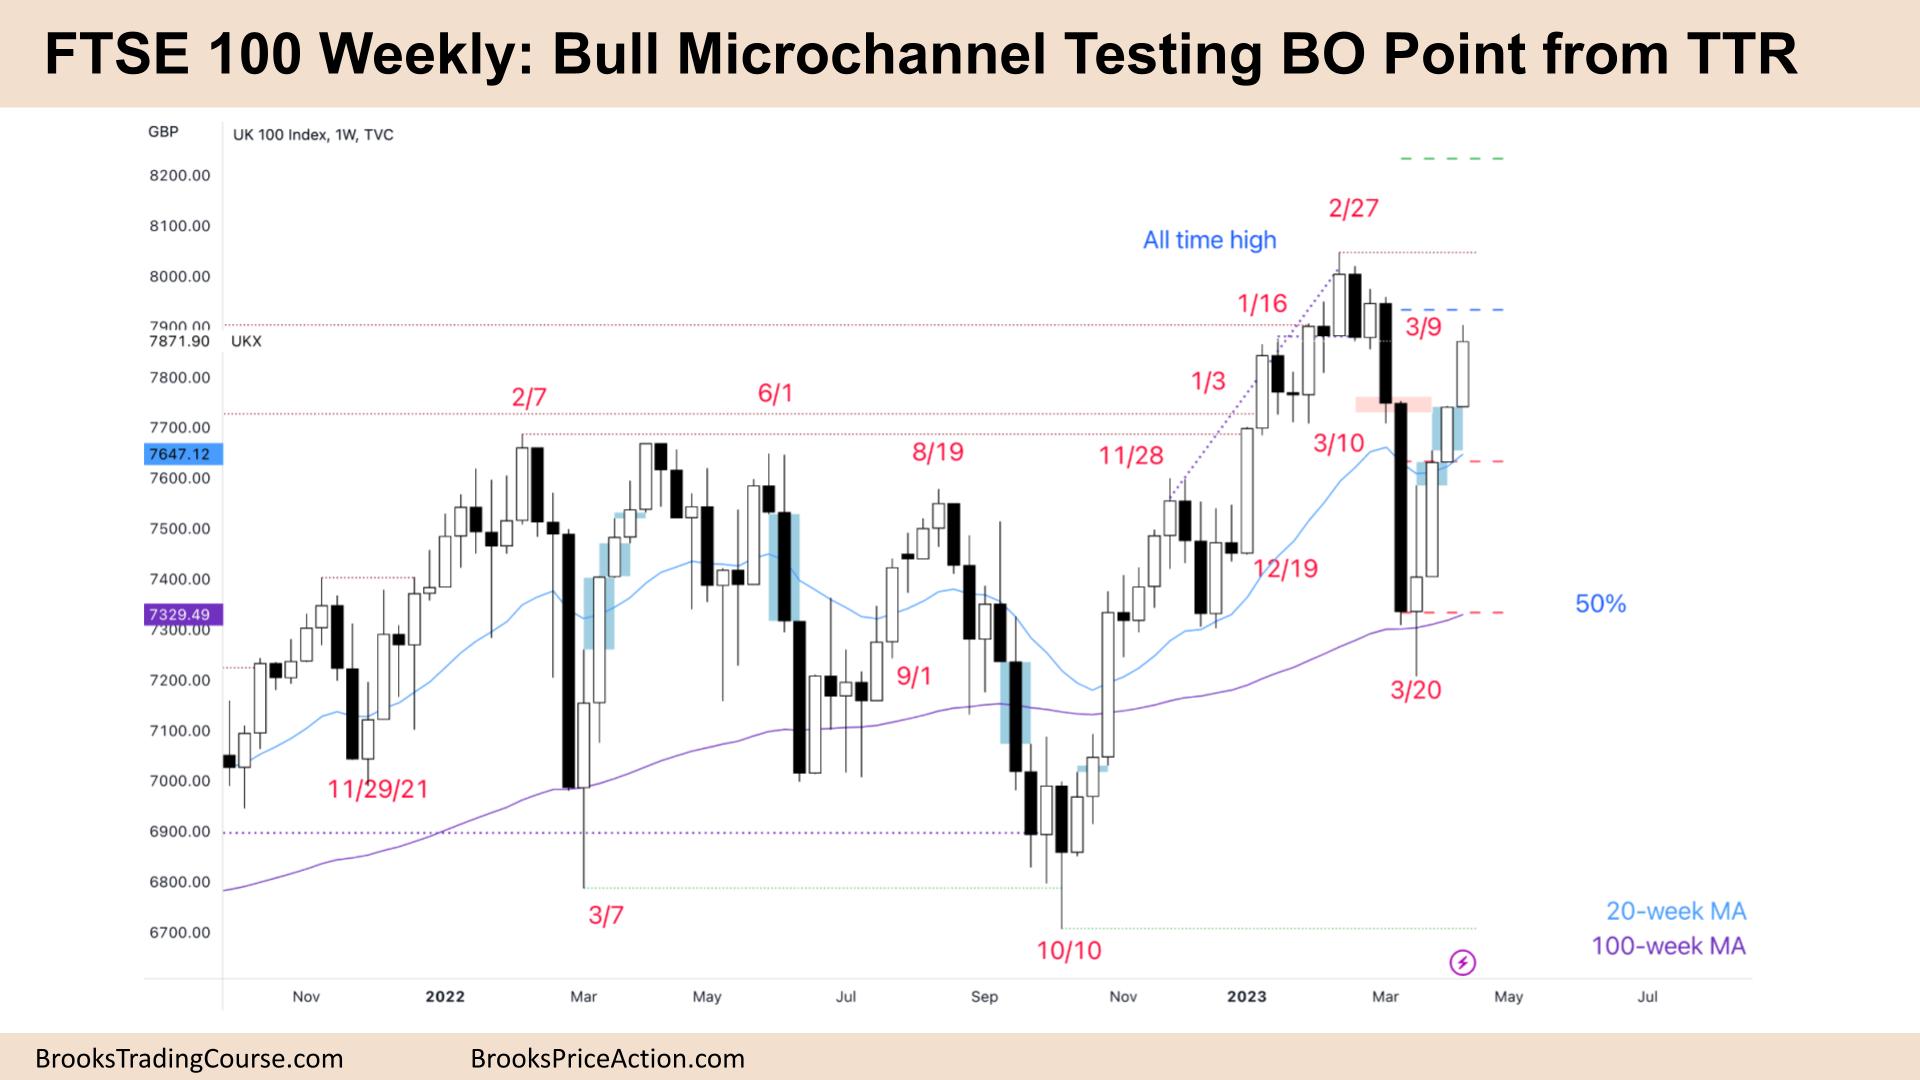
The FTSE futures market has been in a big bull micro channel since it hit the 100-week MA. We now have 2 open micro-gaps between the weeks, creating a layer of support at the prior top of the trading range. This supports the bull case for going higher. The bears know we have been in a trading range for a long time – and the sell climax was disappointing for the bulls. It will provide a reasonable place to sell above the highs.
FTSE 100 Futures
The Weekly FTSE chart

- The FTSE 100 futures was a bull bar closing near its high.
- It is the fourth consecutive bull bar, so we are always in long, and it is a buy-the-close.
- It is a 4-bar bull micro channel, so traders will expect buyers below the low of a prior bar, and a second leg is likely.
- There are 2 open gaps above the moving average, which will act as support on the way back down.
- The last open gap is sitting above the prior high, as bulls are trying to keep the trend alive and not in a trading range.
- The bears saw a wedge top and expected 2 legs sideways to down – the doji on March 13th might have been the second leg.
- This often traps traders – bears scaling into a losing trade and bulls buying higher than they would like.
- The bears see a trading range and selling high in trading, especially a second-entry short is a high probability trade.
- Last week we said that we were back at the bull trap – where the bears got a follow-through climax bar making bulls buy lower.
- For the bulls, it is a trend resumption, a 50% pullback, and they want a higher high. Even though the micro channel is strong, they have the reversal zone above the wedge top.
- The wedge top tested the bottom of the spike and channel – which is disappointing for the bulls. The top of a bear spike is a reasonable sell zone for limit bears.
- The bears want an expanding triangle – a trading range with expanding volatility. They know we broke the swing low – although we did not close below it.
- Looking back at October 2022 – when we broke the swing low – when we returned back to the highs, we formed a double top – so I think we might do the same here.
- There were 8 weeks of tight trading range (TTR) price action at 8000 Big Round Number, so expect some sideways price action then. But in a bull micro channel, it might go further than traders expect.
- It is better to be long or flat. Bulls can get out a scalp below any bar, though expect sideways to up next week.
The Daily FTSE chart

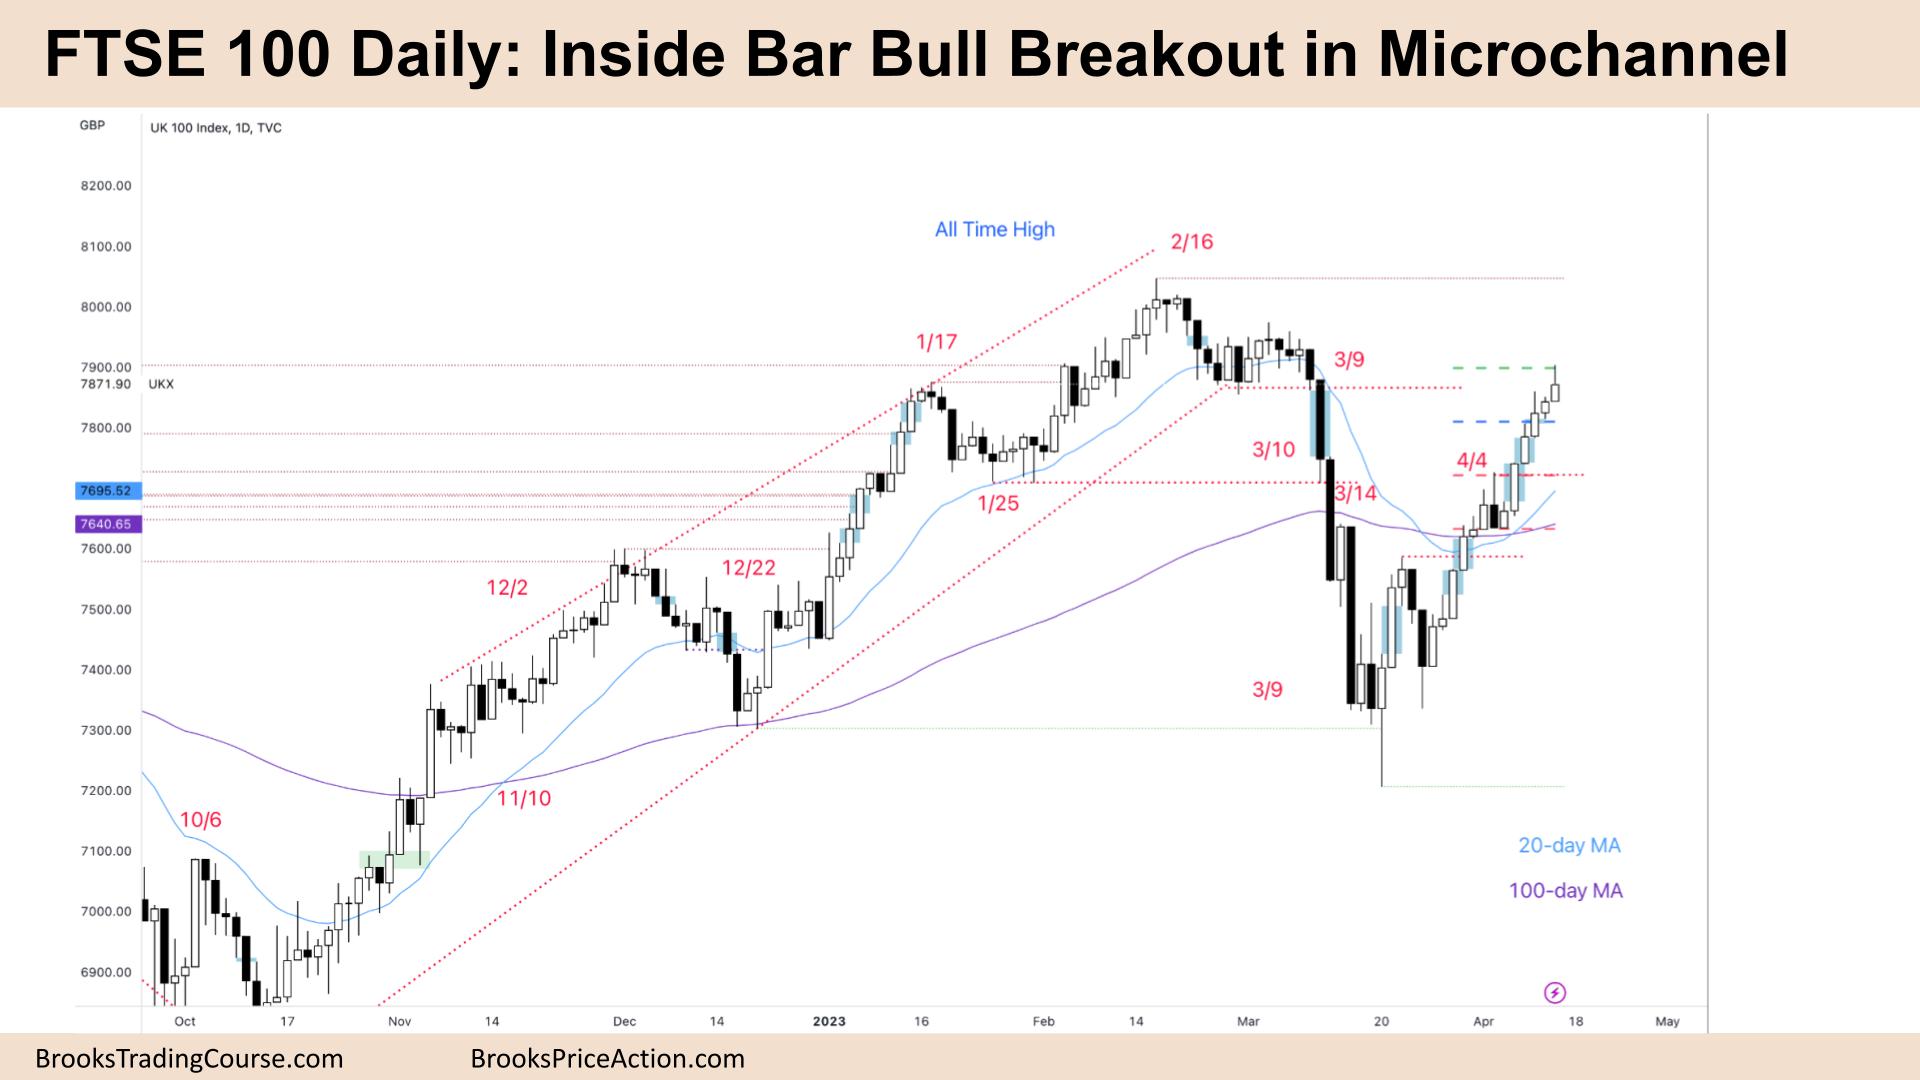
- The FTSE 100 futures was a bull bar closing below its midpoint on Friday. Some computers will see it as a bear bar.
- It is a 13-bar bull micro channel which is unusual and hence climactic. It is a low-probability event, and some bears will be trapped below.
- The bears wanted a double top bear flag, but the bulls got a breakout above the MA. We are at the measured move from the lower low.
- The bulls closed the gap from March 9th when the bears broke below a double bottom and got a parabolic wedge bottom.
- The bulls want to break above the BO point, a failed test and continuation above – it is certainly strong enough to do so.
- But it was disappointing for the bulls. Such a deep spike will encourage bears to short up here and above, scaling in betting on a trading range.
- Thursday was an inside bar – technically a sell above – so Mon or Tuesday might test back down. Bulls should NOT buy below that inside bar – they have a high failure rate in a micro channel this long.
- The bears see a successful test of the BO point and a lower high and want to get a second leg sideways to down – but where are the bear bars?
- April is typically a bullish month for stocks, so it might need to go higher for a few weeks, maybe a new high, to at least 8000 Big Round Number until the bears are willing to sell.
- When the bull channel is tight like this. and the pullbacks are non-existent – it will constantly look like wedge tops are forming – you should ignore them and instead look to get long.
- The bears need a bear bar with follow-through – though it’s likely only a scalp for now.
- Bulls might switch to buying below bars or buying pullbacks – perhaps to the midpoint of the last leg to scale in.
- Better to be long or flat.
Market analysis reports archive
You can access all weekend reports on the Market Analysis page.

