Monthly Emini chart: weak follow-through buying

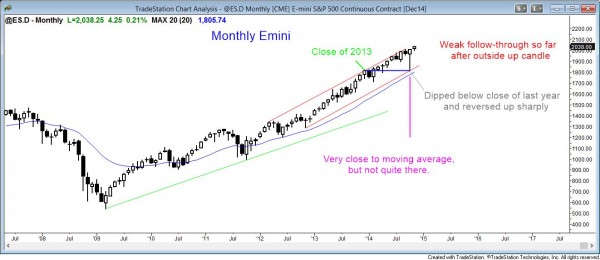
The monthly S&P500 Emini chart: weak entry bar after last month’s bull reversal bar
The monthly Emini chart is very overbought. This makes a trading range likely soon, and it could last a year or more. Bulls will continue to buy selloffs to the moving average and the October low.
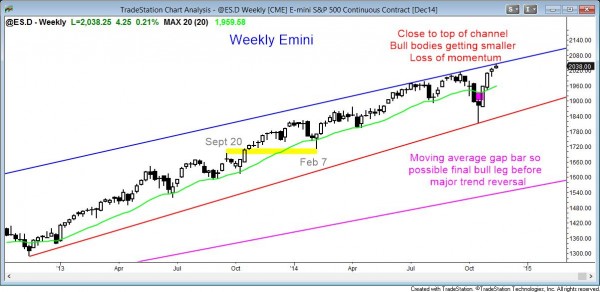
Weekly S&P500 Emini candle chart: bull trend is losing momentum

The Emini weekly bull trend is losing momentum. This is the fourth consecutive bull body in the current bull leg, but the bull bodies are getting smaller.
This week came close to the top of the channel, and it is testing the channel top with waning momentum. This increases the chances of a reversal down to the bottom of the channel soon. However, it might first briefly break strongly above the top of the channel before the reversal takes place. Tests of the top of the channel lead to reversal down to the bottom of the channel in about 75% of cases. About 25% of the time, there is a bull breakout above the top of the channel that leads to an even stronger bull trend. This happened with the monthly stock market charts when the republicans took over the house in November, 1994, and it led to the biggest bull market of our lifetimes.
Daily S&P500 Emini candle chart: tight trading range

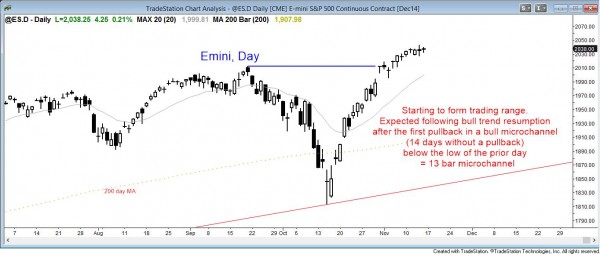
The daily S&P500 Emini candle chart is in the early stage of a tight trading range
As expected, the daily Emini chart has entered a tight trading range, which could last for another week or another month. After having a pullback from a 14 day bull microchannel, the Emini rallied for 7 days.
A protracted microchannel is often an exhaustive move. The first pullback is bought about 90% of the time. However, the rally that follows is usually brief and then the market usually enters a tight trading range for 10 or more bars. The Emini currently is following this pattern. After the trading range, the Emini will decide between trend resumption up or trend reversal down.
Since all higher time frames are so overbought and the Emini is at the top of its weekly channel, the odds are that the upside is limited until after a correction on the weekly chart. A reasonable minimum objective is about ten bars and two legs, which means 2 – 3 months.
Traders can see the end of the day bar-by-bar price action report by signing up for free at BrooksPriceAction.com. I talk about the detailed Emini price action real-time throughout the day in the BrooksPriceAction.com trading room, and a 2 day free trial is available.
When I mention time, it is USA Pacific Standard Time (the Emini day session opens at 6:30 am PST, and closes at 1:15 pm PST). You can read background information on the intraday market reports on the Intraday Market Update page.

