Monthly S&P500 Emini candle chart: Bear ioi sell signal
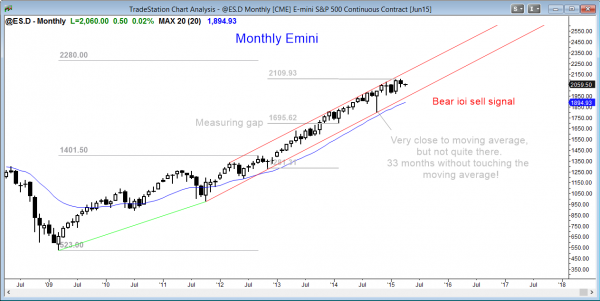
The monthly Emini candle chart is in a strong bull trend, but it formed another bear ioi sell signal with March’s close.
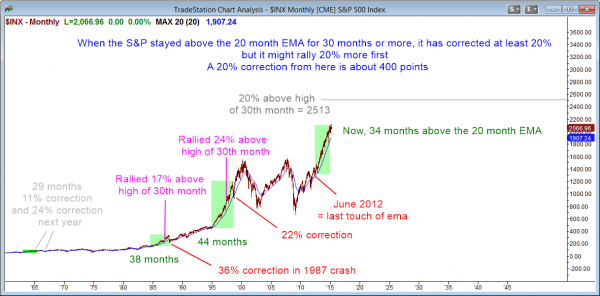
The monthly S&P500 cash index has not touched the moving average in 34 months, which is a type of buy climax. Any unsustainable behavior is a climax.
Friday’s selloff on the unemployment report while the market was closed led to a 20 point drop in the Emini, and this will probably create a gap down on Monday. However, it is still above last month’s low of 2030.75. Since last month is a sell signal bar and its low is close, the market will probably need to go below it to see if there are more buyers or sellers. There was a monthly ioi sell signal in January as well. It triggered briefly, but the market then rallied strongly to go above January’s high and create an outside up month.
The monthly S&P500 Emini candle chart has not touched the moving average since June, 2012, 34 months ago. I have written about this many times. Yes, it is a strong bull trend, but when a trend lasts 20 or more bars without a significant pullback, it is becoming climactic. The longer the extreme behavior continues, the greater the risk of a sharp reversal. Early in a bull trend, there are many value oriented bulls who are willing to add to their positions if the market falls further.
Traders learning how to trade the markets should know that late in a bull trend, many bulls are momentum traders. As soon as there is a sign that the momentum has stopped, they will sell quickly. When a trend is as extreme as this, there are many momentum traders. They do not want any loss and they will quickly sell if the market begins to fall. The result is that the reversal can be very fast and fall much further than traders think is possible. Many bulls will be trapped by the speed of the selling and they will hope for a bounce that will allow them to sell with a smaller loss. This is the cause of a 2nd leg down in a big correction. Bears who missed selling at the high will also look to sell the bounce, and this will add to the momentum down.
April is the 35th month without any monthly candle touching the moving average. The market held above the moving average for 44 months after the Republicans took control of the House in 1995. It then fell 22%. In 1987, the market was above the moving average for 38 months and then fell 36%. There has been no other time in the past 50 years when the market was above the monthly 20 bar EMA for 31 months or longer.
Is it possible for the market to stay above it for many more years? I do not think so. It can get back to the moving average by going sideways for a couple of years, or by going down. In either case, the upside is probably limited, and however further the market rallies without the correction will almost certainly be retraced once the correction occurs. I think buying and planning to hold for 2 or more years is a mistake at the moment. It makes more sense to wait for a pullback below the monthly moving average, which will probably happen this year.
Weekly S&P500 Emini candle chart: Tight trading range in a bull trend
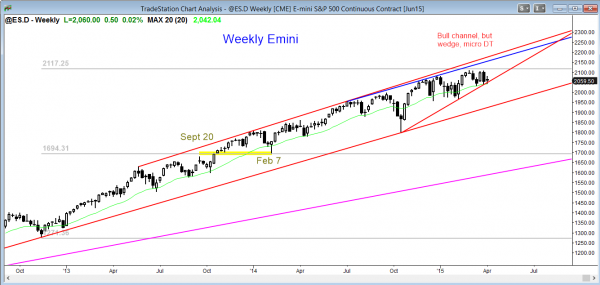
The weekly Emini candle chart is in a tight trading range within a bull trend.
Each bar that gets added to a tight trading range reduces the bullishness of the bull trend. Once there are 20 or more bars like this, the probability of the bull breakout is barely greater than that of the bear breakout. It is close to 50% either way. If there is a bull breakout, a tight trading range late in a bull trend usually becomes the final bull flag before at least 10 bars and 2 legs sideways to down. Since the monthly chart will probably also correct, the 10 bars are on the highest time frame, which means that the correction will probably last about a year, although it could last longer. There is still no sign of a top. If there is a bull breakout, it might help form a better shaped wedge top. If so, a reversal down at that point would then give bears more confidence to sell and bulls less confidence to buy./p>
The weekly S&P500 Emini candle chart is holding above the moving average in a tight trading range. If there is a bull breakout, it probably will fail and this tight trading range would then be the final bull flag.
Daily S&P500 Emini candle chart: Breakout mode
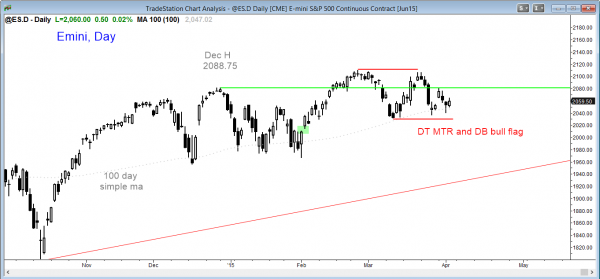
The daily Emini candle chart has been in a trading range for at least 6 months. It is now in a triangle. Although it is still in a broad bull channel, the trend is weaker than the weekly bull trend, which is weaker than the monthly bull trend.
The daily S&P500 Emini candle chart is in a month long triangle within a 6 month long trading range. It is in breakout mode. Until there is a breakout, there is no breakout, and the probability of a successful breakout up or down is only about 40%. There is a 20% chance that a breakout will look good, but then reverse.
Traders can see the end of the day bar-by-bar price action report by signing up for free at BrooksPriceAction.com. I talk about the detailed Emini price action real-time throughout the day in the BrooksPriceAction.com trading room, and a 2 day free trial is available.
When I mention time, it is USA Pacific Standard Time (the Emini day session opens at 6:30 am PST, and closes at 1:15 pm PST). You can read background information on the intraday market reports on the Intraday Market Update page.


