Market Overview: Weekend Market Update
The Emini monthly chart formed an outside up in October. Traders should expect a new all-time high within a few weeks and possibly next week.
The 30 year Treasury bond futures weekly chart will likely fall a little lower before its next bounce in its 3 month trading range.
The EURUSD monthly Forex chart will probably pull back from a strong one month rally in its 21 month bear trend.
30 year Treasury bond futures weekly chart:
Micro wedge bottom but EMA magnet just below
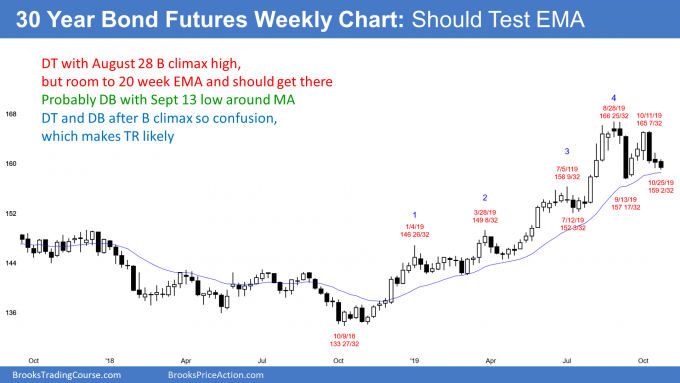
The 30 year Treasury bond futures market has been sideways for 3 months after a buy climax to a new all-time high. The bears got a strong reversal down from a lower high double top 3 weeks ago.
However, the past 2 weeks have been small and have prominent tails in the weekly chart. This is an absence of strong follow-through selling. Also, these bars are forming a micro wedge bottom. This is a loss of momentum down just above the September sell climax low. Therefore traders see the 3 week selloff as a bear leg in a developing trading range rather than the start of a bear trend.
The September 13 low was the bottom of the 1st leg down from the August buy climax. The bulls would like a reversal up from here. That would be a higher low double bottom bull flag in a bull trend. They would then want a rally back up to a new high.
However, there have now been 2 strong reversals down over the past 7 weeks. A resumption of the bull trend up to a new high is not what bull trends typically do in this situation.
The importance of the 20 week EMA
Despite these reversals down, the chart has not pulled back to its 20 week EMA. In fact, it has been above it for more than 30 bars (weeks). That is unusual and therefore unsustainable. Consequently, the chart will probably go sideways to down over the next few weeks until it gets there. The price action cannot deviate from the price for too long. They correspond to one another over time.
Why will market get there? Because traders buying now are paying an above average price. Yet, those 2 big selloffs tell traders that the price action is no longer above average in terms of its bullishness. Many bulls now want to wait to buy at the average price.
Consequently, if there is a rally from here, it will probably be small and not last more than 1 – 2 weeks. Traders will sell above this week’s high because they sense that the bears are getting strong. The bulls will probably be hesitant to pay an above average price. Traders should expect at least slightly lower prices and a test of the EMA over the next few weeks.
EURUSD monthly Forex chart:
Minor reversal up in tight bear channel on monthly chart
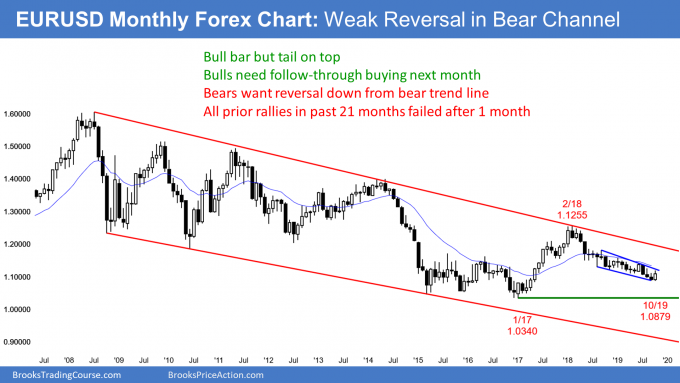
The EURUSD monthly Forex chart has been trading down for 21 months after a strong reversal up in 2017. That low was a lower low major trend reversal. Traders therefore expect at least a small 2nd leg sideways to up after the current reversal down from the February 2018 high.
There have been several reversal attempts, but each one failed within a month. This selloff is therefore also probably a bounce in a 21 month Small Pullback Bear Trend. But as long as the selloff holds above the January 2017 bear trend low, traders still see it as a pullback from a 1st leg up in February 2018 and not a resumption of the 10 year bear trend.
Every bear channel behaves like a bull flag since there is a 75% chance of an eventual bull breakout. Traders expect a bull breakout and a rally before a drop below the 2017 low. The minimum goal is a retracement of about half of the 21 month selloff.
That would also correspond to around the June 2018 high. That was the top of the 1st pullback after the initial strong reversal down in April and May 2018. The start of a bear channel is always a magnet after a reversal up. But the bears took a year and a half to get down here. The bulls will probably need many months to get back up there.
Reversal up from tight bear channel is usually minor
A reversal up from a Small Pullback Bear Trend is typically minor. That means that the current rally might last a few bars (months), but there will then probably be a test back down.
A second reversal up at that point would be from a double bottom, which would be a major trend reversal setup. The bulls would have a better chance of a more sustained rally to the June 2018 high of 1.1851 at that point. That is a major lower high on the weekly chart (not shown). It is also the top of the 1st pullback after the early 2018 strong bear breakout.
Monthly S&P500 Emini futures chart:
Bull outside up bar in October ahead of October FOMC announcement
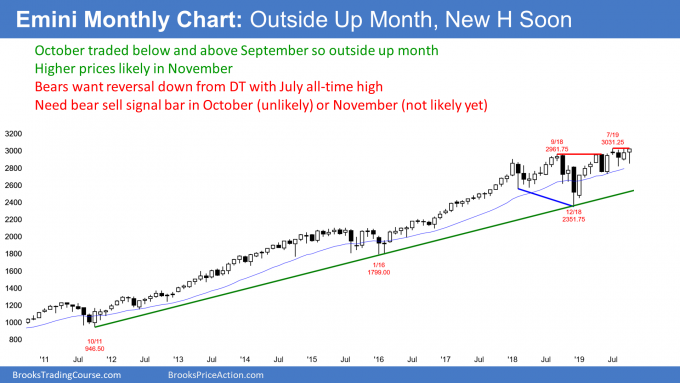
The monthly S&P500 Emini futures chart triggered an oo buy signal when July went above the June high. June and May were consecutive outside bars, which is an oo (outside-outside) bull flag. Rather than rallying, the Emini has stalled. It has been sideways in a tight trading range for 4 months and within a slightly bigger trading range for 7 months. However, it is still in a bull trend, and therefore traders expect higher prices.
October traded below the September low. On Friday, it traded above the September high, which is slightly below the July all-time high. October is now an outside up bar. That increases the chance of higher prices in November. The probability will increase if October closes above the September high and the all-time high. It would increase further if it closes on the high of the month and far above that resistance.
With the Emini within about 1% of the all-time high, it could easily get there next week. If it closes at a new all-time high, that would be an additional sign of strength and further increase the chance of higher prices in November.
There is always a bear case. The bears have a 40% chance of big bear bar in in November. If they get it, November would be a sell signal bar for December.
But it would also be the 5th bar in a tight trading range in a strong bull trend. That would make it a weak sell setup. The best the bears can probably achieve in November is another sideways month in the 5 month trading range.
Weekly S&P500 Emini futures chart:
Weak breakout above small bull flag, but just below all-time high
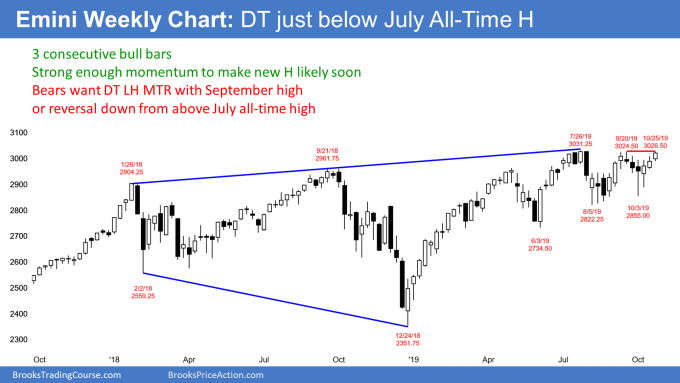
The weekly S&P500 Emini futures chart triggered a High 1 bull flag buy signal 2 weeks ago when that week traded above the high of the week before. Because the past 6 weeks have had prominent tails and had been sideways, traders are selling rallies and buying selloffs. Therefore, the buy signal was weak.
The entry bar 2 weeks ago was small and therefore not strong. This week was the follow-through bar. IT closed on its high, which is more bullish, but its range was small.
Nevertheless, the chart is forming higher lows and it is still in a bull trend. Traders believe that the Emini will make a new high within the next few weeks, and possibly next week.
The bears have a 30% chance of a strong reversal down next week. If they succeed, there would then be a double top with the September high. But because of the higher lows and strong yearlong bull trend, the reversal down would likely be minor. That means that the bears might get a 2 – 3 week pullback to the October low, which is the neck line of the small double top.
It is unlikely that they will get a strong breakout below that neck line and then a measured move down. The selloff would probably just be a brief leg down in the 4 month trading range.
Daily S&P500 Emini futures chart:
Many reversals over past 2 weeks ahead of October FOMC announcement
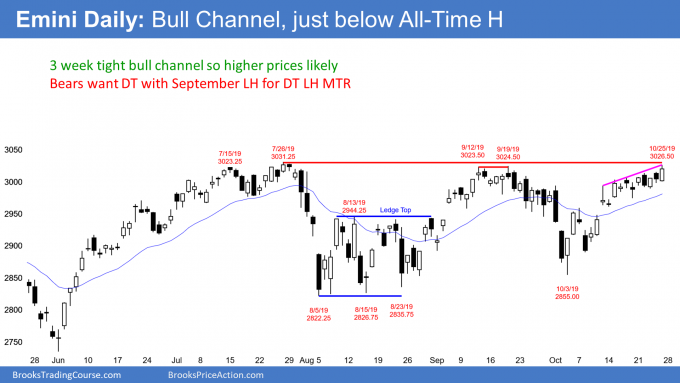
The daily S&P500 Emini futures chart has been in a weak bull channel for a couple of weeks. It is essentially in a small, tight trading range that is tilted slightly up. There have reversals every couple of days. Even though it is channeling up, this is still a type of Breakout Mode pattern.
When there is a horizontal Breakout Mode pattern, there is about a 50% chance of a successful bull breakout and a 50% chance of a successful bear breakout. Furthermore, there is a 50% chance that the 1st breakout up or down will fail and reverse.
But this is different because the tight range is tilted up. In this case, the chance of a successful bull breakout is 60%. The Emini might waiting for Wednesday’s 11 am PST FOMC announcement before it breaks out up or down.
Trading Room
Traders can see the end of the day bar-by-bar price action report by signing up for free at BrooksPriceAction.com. I talk about the detailed Emini price action real-time throughout the day in the BrooksPriceAction.com trading room. We offer a 2 day free trial.
Charts use Pacific Standard Time
When I mention time, it is USA Pacific Standard Time (the Emini day session opens at 6:30 am PST, and closes at 1:15 pm PST). You can read background information on the intraday market reports on the Market Update page.

