Monthly Emini chart: weak follow-through buying

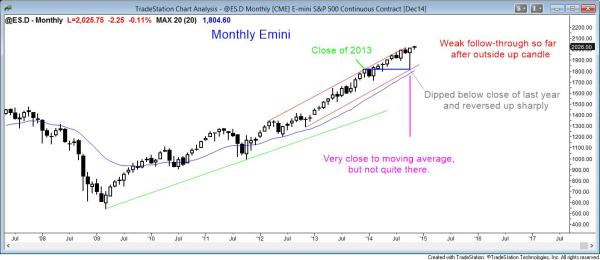
The monthly S&P500 Emini chart has had weak follow-through buying after last month’s strong bull reversal. However, it is too early in the month to draw any conclusions.
I have talked many times about how overbought the monthly chart is, but there is no top. An overbought market can get far more overbought than what anyone thinks is likely. However, Because it is so overbought, the odds favor a trading range, which could last a year or more. It is unlikely to become a bear trend without transitioning first into a trading range. Once in a range, it can then begin to develop enough selling pressure to give the bears a reasonable chance of a reversal. Until then, selloffs will probably continue to be bought. Support is around the moving average, which is rising and is currently near the October low.
Weekly S&P500 Emini candle chart: weak follow-through buying

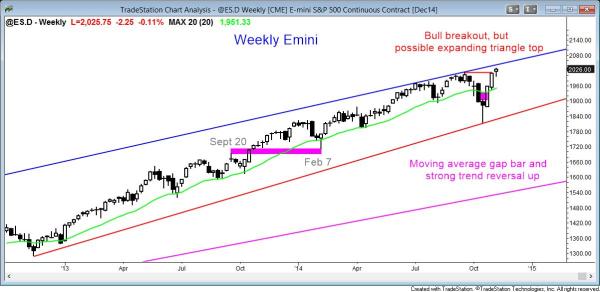
The weekly Emini chart had weak follow-through buying after a three week bull trend reversal. The bulls want a measured move up after breakout above a 6 month trading range. The bears want an expanding triangle top.
Because the weekly chart had a moving average gap bar several weeks ago, the odds are that this rally will be the final one before a major trend reversal triggers. If one does, it will probably be followed by at least 10 bars and two legs sideways to down. The bulls will see the selloff as an ABC bull flag (a high 2 buy setup). The bears hope that it will be the start of a trend that will retrace much of the rally of the past several years. The bull case has a higher probability. Most major trend reversals create big trading ranges, even though 40% fall far enough for a swing trade.
Since the reversal up was so strong over the past few weeks, the first selloff will probably be bought. This means that any top would probably need at least 3 or 4 weeks to create a second entry sell setup, which has a higher probability of leading to a profitable short.
Daily S&P500 Emini candle chart: strong bull breakout, but possibly climactic

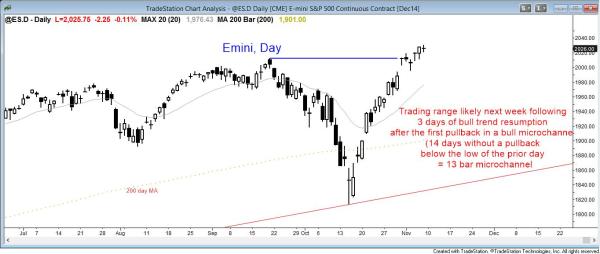
The daily S&P500 Emini candle chart had a 14 bar bull microchannel (14 consecutive bars where the low is above the low of the prior bar). It broke below the channel for one day and the bull trend then resumed.
The daily Emini chart has been in an exceptionally strong bull trend for several weeks. It is breaking out to a new all-time high. However, instead of having consecutive big bull trend bars closing on their highs, the breakout has been made of 5 dojis and one small bull bar. This indicates hesitation and is not a strong breakout.
Although a trend as strong as this might lead to a measured move up, possibly based on the height of the 6 month trading range, it might be up too strongly. When the Emini breaks below a protracted bull microchannel for only one day and then resumes up, the rally usually lasts for a few days and then the trend is exhausted. The Emini is likely to enter a tight trading range for about 10 bars (days). After that, it will decide between bull trend resumption and a bear trend reversal (a big expanding triangle top).
There is a strong bullish seasonal tendency from November 11 to December 5. In about 80% of years, the close on December 5 is above the close of November 11. Even though the Emini will probably enter a trading range for a couple of weeks, it might then test up into December 5. There is also a Wall St. adage…»Thanksgiving is owned by the bears, but Christmas is owned by the bulls.: I do not think it is particularly useful to traders because the Emini probably will not have more than a small pullback for at least a couple of weeks, but knowing things like this is simply part of the business. It makes you feel more like a member of the club!
Traders can see the end of the day bar-by-bar price action report by signing up for free at BrooksPriceAction.com. I talk about the detailed Emini price action real-time throughout the day in the BrooksPriceAction.com trading room, and a 2 day free trial is available.
When I mention time, it is USA Pacific Standard Time (the Emini day session opens at 6:30 am PST, and closes at 1:15 pm PST). You can read background information on the intraday market reports on the Intraday Market Update page.

