Market Overview: Crude Oil Futures
The weekly chart formed a Crude Oil two-legged pullback, closing below the 20-week EMA. The bears need to create follow-through selling below the 20-week EMA to increase the odds of a reversal lower. The bulls want a reversal up from a double bottom bull flag (Oct 6 and Nov 3).
Crude oil futures
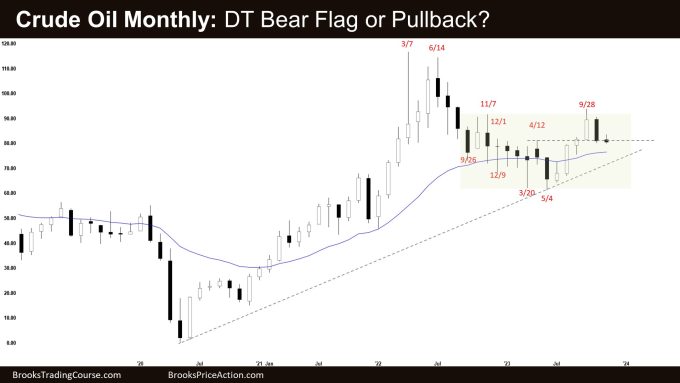
The Monthly crude oil chart

- The October monthly Crude Oil candlestick was a bear bar closing near its low and below September low.
- Previously, the bulls got a reversal up from a wedge bull flag (Dec 9, Mar 20, and May 4) and a double bottom (Mar 20 and May 4), testing the November 2022 high.
- The move-up was in a tight bull channel and a 5-bar bull microchannel. The streak ended in October.
- There may be buyers below the first pullback below such a strong bull microchannel.
- The bulls see the current pullback simply as a breakout test of the April high (breakout point).
- If the market trades lower, they want the 20-month EMA or the bull trend line to act as support.
- The bears hope to get a reversal from a double top bear flag with the November 2022 high.
- They see the market as forming a larger trading range and want a reversal down from a lower high major trend reversal.
- They need to create follow-through selling in November, preferably closing below the 20-month EMA to increase the odds of lower prices.
- Since October was a bear bar closing near its low, it is a sell signal bar for November.
- For now, odds slightly favor November to trade at least a little lower.
- Traders will see if the bears can get a follow-through bear bar or will November trade slightly lower but stall and close with a long tail below or with a bull body?
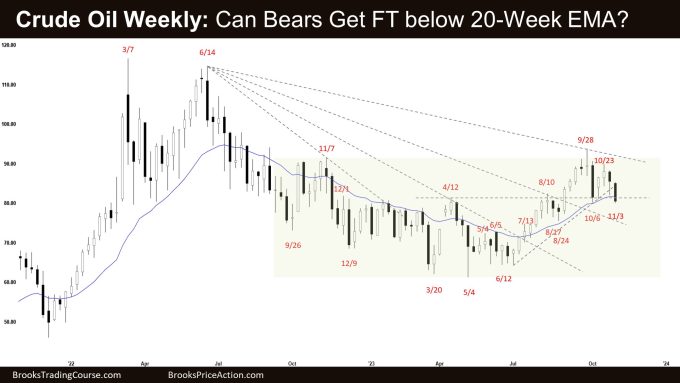
The Weekly crude oil chart

- This week’s candlestick on the weekly Crude Oil chart was a bear bar closing near its low and below the 20-week EMA.
- Last week, we said that traders will see if the bears can create follow-through selling or if will they fail to do so like the first leg down (Oct 6).
- The bears manage to get follow-through selling and a larger second leg sideways to down.
- They want a reversal from a larger double top bear flag (Nov 17, 2022, and Sept 28) and a lower high major trend reversal (Oct 23).
- They hope that the strong move up (from Jun to Sept) was simply a buy vacuum and a bull leg within a larger trading range.
- Since this week closed below the 20-week EMA, the bears will need to create a follow-through bear bar to increase the odds of lower prices.
- Previously, the bulls had a tight bull channel from June to September.
- They see the current move as a two-legged pullback, forming a double bottom bull flag (Oct 6 and Nov 3).
- They want the 20-week EMA to act as support, followed by a reversal to retest the September high.
- They hope to get a measured move based on the height of the 41-week trading range, which will take them to around $103.
- Since this week’s candlestick is a bear bar closing near its low, it is a sell signal bar for next week.
- Odds slightly favor the market to trade at least a little lower.
- Traders will see if the bears can create a follow-through bear bar or will the bulls be able to get a reversal closing back above the 20-week EMA.
- For now, while the market can still trade sideways to down for a while more, odds slightly favor the current pullback to be minor.
- However, if the bears get a couple of strong consecutive bear bars, it will swing the odds in favor of the bear leg beginning.
Market analysis reports archive
You can access all weekend reports on the Market Analysis page.

