Monthly S&P500 Emini futures candlestick chart:
Trump rally reversing into 5% 100 point March correction
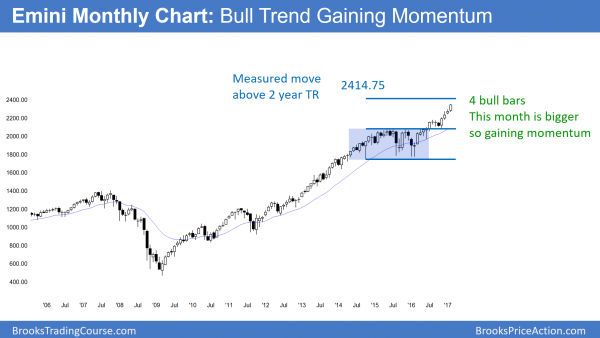
The monthly S&P500 Emini futures candlestick chart has a big bull trend bar so far in February. In addition, the rally is testing measured move targets.
The monthly S&P500 Emini futures candlestick chart has a big bull trend bar so far this month. The rally is close to the 2400 Big Round Number. While the rally has already reached several measured move targets, there is one target left at 2414.75. The November selloff barely overlapped the August high. It therefore created a negative gap. If the October 2014 low is the bottom of the trading range, then 2414.75 is the target. Yet, if more computers use the January low, then the target is 2384.25.
In either case, the odds are that this strong rally will probably not go much higher before the stock market pulls back. While the bottom of the buy climax at the November 2073.75 low is the ultimate target within a year or two, the current rally is strong. Therefore, bulls will probably buy the 1st reversal. Hence, the bears will likely need at least a micro double top before they will reach 2073.75.
Since the bulls want to buy at support, traders need to look for support. One good choice is the close of 2016, which is 2236.25. A correction to that level would be about 140 points and 5%. The odds are that the bears will reach that target within a few months.
Weekly S&P500 Emini futures candlestick chart:
Gap up, but probable exhaustion gap and possible island top
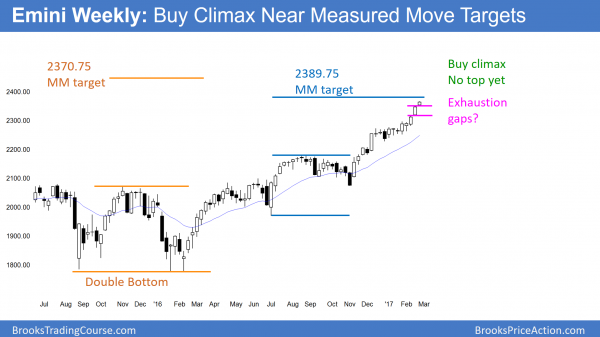
The weekly S&P500 Emini futures candlestick chart gapped up again for the 2nd consecutive week. This is unusual and therefore unsustainable and climactic. The gap will therefore probably close and become an exhaustion gap. If next week gaps down, this week will be an island top.
The weekly S&P500 Emini futures candlestick chart gapped up for the 2nd week in a row. Because that is unusual, it is more likely a buy climax than the start of a stronger swing up. Hence, the Emini will probably close this week’s gap within the next few weeks. It would therefore become an exhaustion gap rather than a measuring gap.
Furthermore, if Monday gaps down, then this week would be a 1 bar island top. Most island tops lead to minor reversals. However, many major tops begin with gaps, such as a gap that forms an island top.
Far above the average price
The weekly chart is far above its average price (the moving average). That makes bulls hesitant to buy. They prefer to buy closer to the average price. Hence the rally will probably stall here. Furthermore, the Emini will probably go sideways to down until it gets closer to the moving average.
Spike and Channel bull trend
The December 9 breakout was a spike that led to a parabolic wedge bull channel. Since a spike and channel pattern usually leads to a trading range, that is what is likely over the next several weeks. Typically, the bottom of the trading range is around the bottom of the wedge bull channel. That is the December 30 low, which was the 1st pullback after the breakout. Furthermore, it is the close of 2016.
Test of the 2016 close
When a year rallies strongly from the start, it usually pulls back to test last year’s close. In addition, it usually dips below that close. As a result, the news will try to create panic by proclaiming that the correction gave back all of the year’s gains.
Therefore, the Emini will probably test 2236.25 at some point this year. Since the Emini is in a buy climax in a cluster of measured move targets, this is a likely price level for the correction to begin. If this week was the top of the rally, then the correction might be about 140 points, or about 5%.
One more measured move target
While a 5% correction might have begun, there is still one more measured move target above on the weekly chart. The December 2 pullback tested the August high and reversed up. That therefore created a possible measuring gap. Many bulls will use the July 1 bottom of the bull breakout to calculate the target. Hence, there is a magnet at 2389.75.
Since bulls will probably buy a test of last year’s close, the Emini might not reach the final target until after the correction.
Daily S&P500 Emini futures candlestick chart:
Buy climax and possible island top at measured move targets
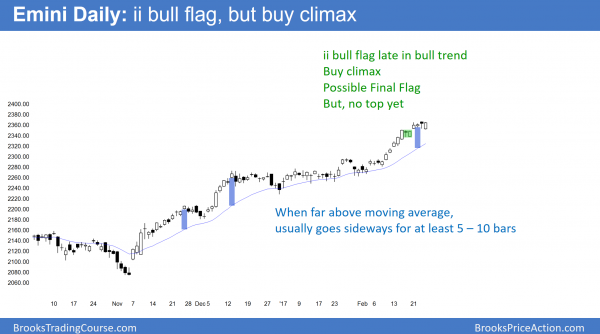
The daily S&P500 Emini futures candlestick chart probably entered a trading range with last week’s ii pattern. That ii is therefore probably the final bull flag. A gap down next week will create an island top. Because the Emini is so far above its average price (the moving average), the odds are against significantly higher prices near term.
The daily S&P500 Emini futures candlestick chart went sideways this week after an ii 2 weeks ago. When an ii forms late in a bull trend, it often becomes the final bull flag. Hence, the bull breakout usually only lasts a few bar. Most final flags lead to trading ranges, and not bear trends.
Furthermore, since the February rally had 9 bull bars in 10 days, it was strong. Strong rallies usually do not reverse into bear trends without first transitioning into trading ranges. Therefore, the best the bears will probably get over the next week is more trading range price action. The pullback from an ii usually tests the bottom of the ii. Hence, the bottom of the developing trading range will probably be around 2336.
Strong bull trend
While the Emini has been very strong, the daily chart, like the weekly chart, is far above its moving average. As a result, many bulls do not want to buy too high. Hence, there is a relative lack of buyers. Therefore, the rally usually stalls until the Emini gets closer to the average price. As a result, the Emini will probably go sideways for at least another week. In addition, with the FOMC meeting 3 weeks away, the Emini might enter a tight trading range until the March 15 Fed announcement.
March 15 FOMC Fed interest rate hike?
Will the Fed raise interest rates in 3 weeks at its FOMC meeting? They have been talking about raising rates for a year. Furthermore, the stock market is very strong. It is therefore likely to withstand any surprise fairly well. As a result, traders expect a rate hike in March or soon afterwards.
News reports after a catalyst
Will a March rate hike be the catalyst for the 5% correction? It could be, but the correction can begin at anytime because the technical factors indicate that the correction is likely soon. This is true whether or not the Fed raises rates. In fact, if the Fed does not raise rates and the correction then begins, the news will report that the correction was because of the lack of a rate hike. They would explain that the Fed thought that the economy was weak, and traders concluded that it was therefore overpriced!
This double speak was very common 20 – 30 years ago. Whenever the market reacted to a news event, tv said the move was due to the news. If the news was the same next month, but the market went the opposite way, tv again said the move was due to the news, but they gave an opposite explanation. Furthermore, they did it with a straight face, oblivious to how stupid they sounded.
Traders can see the end of the day bar-by-bar price action report by signing up for free at BrooksPriceAction.com. I talk about the detailed Emini price action real-time throughout the day in the BrooksPriceAction.com trading room. We offer a 2 day free trial.
When I mention time, it is USA Pacific Standard Time (the Emini day session opens at 6:30 am PST, and closes at 1:15 pm PST). You can read background information on the intraday market reports on the Intraday Market Update page.


