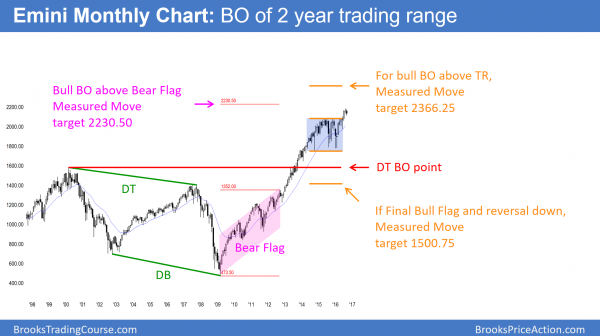
Monthly S&P500 Emini futures candlestick chart:
Reversal down into a bull flag
The monthly S&P500 Emini futures candlestick chart is pulling back into a bull flag. Less likely, this is the start of a major Final Bull Flag reversal.
The monthly S&P500 Emini futures candlestick chart had 7 consecutive bull trend bars prior to this month. Because that is very unusual on the monthly chart, it is unsustainable. Hence, it is a type of buy climax. While the monthly chart is still bullish, the odds are that it will have a bear body this month.
Seven consecutive bull trend bars is a sign of strong bulls. As a result, the bulls will probably buy the 1st pullback, which is the current selloff. In conclusion, the Emini is short-term bearish as it pulls back after a buy climax. Yet, the pullback will probably lead to a new high after a month or two.
Exhaustion gap more likely than measuring gap
The gap between the low of the month and the July 2015 top of the trading range will probably close before there is a new high. This is because the 2 year trading range formed after close to 100 bars in the bull trend. A breakout above a trading range late in a bull trend rarely can maintain a gap. Thus, the odds are that the gap will close.
The bears see the 2 month trading range as the Final Bull Flag. Hence, they are hoping that this reversal is the start of a bear trend. There is a 40% chance that they are right. Since the momentum up is strong, it is more likely that bulls will soon buy the pullback. As a result, the odds favor one more new high.
While it is possible that the gap stays open and becomes a measuring gap, the probability is that it will close.
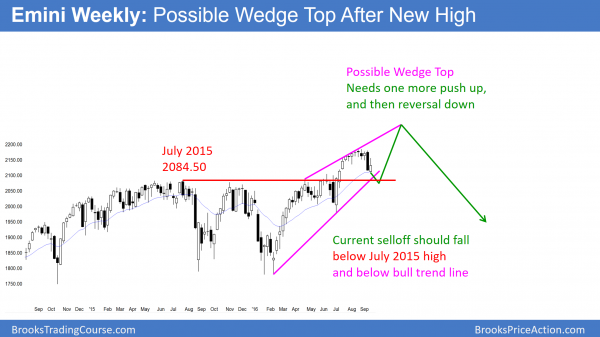
Weekly S&P500 Emini futures candlestick chart:
Bad follow-through selling after last week’s strong bear bar.
The weekly S&P500 Emini futures candlestick chart bounced at the moving average this week. Furthermore, this week’s candlestick had a bull body.
The weekly S&P500 Emini futures candlestick chart this week had a bull body. It therefore was weak follow-through for the bears. Because the momentum up from the July rally was so exceptionally strong, the odds are that the current selloff will be a bull flag. However, the odds are that the Emini will hit the bull trend line and fall below the July 2015 high before the bulls return. Because both are obvious support and the Emini is now close to them, the odds are that the Emini cannot escape their magnetic pull. Therefore, many bulls will wait for a test below support before buying a reversal up.
Possible Wedge Top
While it is possible that the Emini reverses up here at the moving average, it is more likely that it will close the gap first. If the Emini rallies to a new high and then reverses down, then the rally from the July low would be a Wedge Higher High Major Trend Reversal. The 2 year trading range would be the Final Bull Flag.
Most wedge tops have overlapping legs. Hence, the rally usually does not have gaps. This therefore means that the pullback from the 2nd leg up usually falls below the top of the 1st leg up. The second leg up ended with the August 26 high on the weekly chart. The high of the 1st leg up was the June 10 high of 2104.25. Therefore the odds are that the current selloff will fall at least a little below 2104.25 before the 3rd leg up begins.
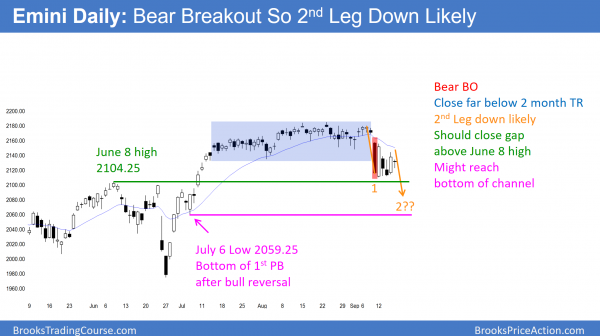
Daily S&P500 Emini futures candlestick chart:
Tight trading range bear flag before September FOMC Fed rate hike
The daily S&P500 Emini futures candlestick chart has been in a tight trading range for 6 days. This is a bear flag after last week’s strong bear breakout.
The daily S&P500 Emini futures candlestick chart has bee in a tight trading range for 6 days. Because it follows a strong reversal down, it is a bear flag. Thus, it is more likely to have a bear breakout. Since the gap up on the monthly chart will probably close this month, that is another reason to expect a bear breakout.
Spike and Channel Bull Trend
The daily chart has a Spike and Channel Bull Trend. The spike is the July rally. The channel began with the July 6 1st pullback. When Spike and Channel tops reverse down, there is a 50% chance that the selloff will reach the bottom of that 1st pullback. That low is 2059.25. Spike and Channel trends usually lead to trading ranges.
Measuring Gap unlikely
Traders always have to be respectful of institutions with the opposite opinion. They see this selloff as a breakout test of the top of the 2 year trading range. Furthermore, they want the gap to remain open and become a Measuring Gap. Because the 2 year trading range is 300 points tall, the bulls are looking for a rally to around 2350 – 2400. While there is a 40% chance that they will reach their target, there is a 60% chance that the Final Bull Flag will reverse down before the bulls hit their target.
September FOMC meeting and a possible interest rate hike
TV pundits say that the market has priced in the rate hike, but that the hike will be in December, not September. I don’t know and I don’t care. All I care about is what the market is doing, not what the Fed is doing. I make money trading the market, not trading the Fed.
The FOMC meeting is a potential catalyst to a breakout up or down. I will trade in the direction of the breakout if it is strong. Since 50% of breakouts of tight ranges reverse, I will be ready to trade in the opposite direction if the breakout fails. Because the charts say that the 2104.25 gap will close, the odds are an FOMC rally will fail if the Emini does not 1st close the gap. Yet, if the rally is strong and the gap stays open, I will buy and not worry that a low probability event is unfolding.
Traders can see the end of the day bar-by-bar price action report by signing up for free at BrooksPriceAction.com. I talk about the detailed Emini price action real-time throughout the day in the BrooksPriceAction.com trading room. We offer a 2 day free trial.
When I mention time, it is USA Pacific Standard Time (the Emini day session opens at 6:30 am PST, and closes at 1:15 pm PST). You can read background information on the intraday market reports on the Intraday Market Update page.


