Monthly S&P500 Emini futures candlestick chart: Online trading after the Brexit stock market crash
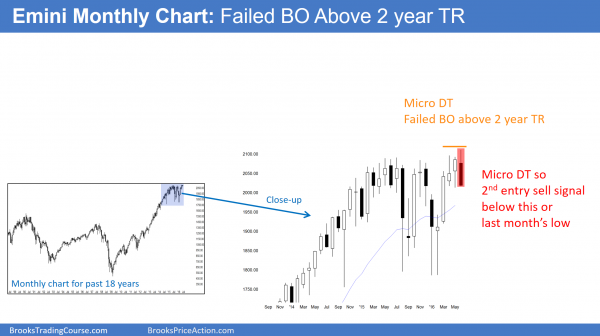
The monthly S&P500 Emini futures candlestick chart is forming a sell signal bar and a micro double top with the April high.
Online trading after the Brexit stock market crash will be tricky until the charts provide more information. Friday’s big bear reversal turned the monthly S&P500 Emini futures candlestick pattern into a bear reversal bar. However, there is still a week to go, and the candlestick pattern might look very different once it closes.
The bears see June as a sell signal bar and a micro double top with April. May traded below April to trigger a sell signal because of the failed breakout above the 2 year range. If July trades below June, that would be the 2nd signal. Consequently, like all 2nd signals, the probability for the bears would be higher. If July is a big bear bar closing on its low, the odds would favor lower prices.
Is context more important than momentum?
As much as Friday was good for the bears, there was a strong 4 month rally preceding this top. That bullish momentum reduces the probability that a swing down will fall far. The momentum up is good for the bulls. They have a 4 month rally within the 2 year trading range. The 2 year trading range is a bull flag in a 7 year bull trend. Hence, a trading range is almost as likely as a strong bear reversal at this point. Yet, the bears would not have to do much more to clearly take control.
The context is good for the bears. They have a 2nd entry sell signal at the top of a trading range. Because both the bulls and bears have reasonable arguments, the Emini might go sideways for more bars on the monthly chart.
The bears need a strong sell signal bar. They want June to close near its low. In addition, they want July to be a strong entry bar. Most of all, they want July to be a very big bear trend bar that closes on its low.
The bulls always want the opposite of the bears. They want July to be a weak entry bar. Furthermore, they then want a reversal back up and then a new all-time high. July will be an important month because it will give traders information about what to expect this fall.
Is the top in?
I have been saying for 2 years that the Emini would probably test the 1500 area. That is the 2000 and 2007 double top. This is because the buy climax on the monthly chart would likely correct down. That buy climax reduced the chances that the bull trend would continue much longer. There was a chance of a bull breakout of the 2 year range. Had that happened, it probably would have failed. As a result, the 2 year range would have been the Final Bull Flag on the monthly chart.
Because this candlestick pattern is on the monthly chart, it can take a long time to unfold. Is this the start of a bear trend on the daily and then the monthly chart? Traders need more proof. They need closes below key support. Especially relevant is the May low, which is the bottom of the 3 month trading range. If the Emini gets 2 or more closes below that low, the odds of a measured move down will probably be more than 50%.
Weekly S&P500 Emini futures candlestick chart:
Big outside down candlestick pattern, but still within trading range
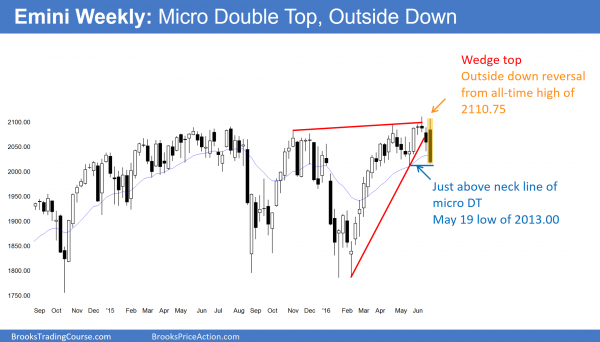
The weekly S&P500 Emini futures candlestick chart had a big bear bar this week and was outside of last week. However, it is still within a 3 month trading range. There is no breakout until there is a breakout.
I have been saying since early April that the strong rally on the weekly S&P500 Emini futures candlestick chart was a buy climax. It therefore was likely to pull back for a few weeks. Furthermore, the rally was likely to resume, test the micro channel high, and then reverse down and form a trading range. This is exactly what happened.
What is next? Trading ranges resist change. This week was a big outside down week, which is good for the bears. However, especially relevant is that the Emini is still above the May low, which is the bottom of the range. That is also the neck line of the April-June double top. To have higher probability of a swing down, they need a close far below that breakout point. They also need follow-through selling. Without that, the 3 month trading range will probably continue. In conclusion, although this has been a good week for the bears, they need to do more. Traders sill believe that Friday’s selloff might only be a bear leg in the 3 month trading range.
Daily S&P500 Emini futures candlestick chart:
Strong bear reversal
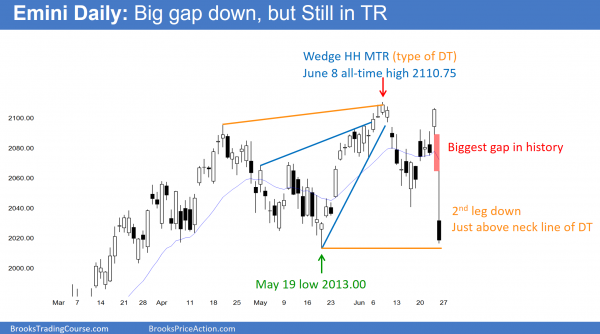
The daily S&P500 Emini futures candlestick chart had a huge gap down, but failed to close below the May low. That is the neck line of the April-June double top. It is therefore still within the 3 month trading range.
The daily S&P500 Emini futures candlestick chart had a very unusual day Friday. It turned the daily chart into the most important time frame. It had a 24.25 point gap down, which is the biggest gap up or down that I can remember. The bigger a gap down is, the more likely it will lead to further selling.
After trying to reverse up Friday on the 5 minute chart, the Emini sold off again below the June 16 low. That low is the neck line for the June 8 and June 23 double top. The bears got a daily close below that low. Most of all, the bears need a close far below the May low, or 2 – 3 closes just below the May low. If they get that, they will have a 60% chance of a measured move down.
There is a 40% chance of a gap below the May low on Monday. If the bears get it, there is a 50% chance of a rally that closes the gap, and a 50% chance that the gap will stay open. If there is a big bear trend bar that closes on its low on Monday, then a measured move below the 4 month trading range will probably follow. If there is weak follow-through selling, traders will look for the breakout to fail and for the Emini to reverse back up into the trading range.
Possible 2nd leg trap in trading range
If the bears do not get strong selling, this selloff might be just a 2nd leg trap in a 4 month trading range. If the Emini starts to form a bear flag over the next 10 days, traders will watch for a bull breakout above the flag. If they get it, there would be at least a 50% chance of a measured move up and another test of the high.
In conclusion, just as I wrote weeks ago that the attempt to break above the trading range disappointed the bulls, this selloff is disappointing the bears. The bears got near the May low, but could not close below it. While next week might test 2000, it might hold above the May 2013.00 low. If it does, it could trade sideways to up for a couple of weeks and form a bear flag. At that point, there would be a 50% chance of a bull breakout above that bear flag and a measured move up. The bears need to do more to make traders believe that this is more than just a 2nd leg trap in a trading range.
Last week of June is bullish
One final point is that the last week of June is one of the most reliably bullish weeks of the year. This is consistent with the Emini going sideways to up this week after Friday’s sell climax. There is a 50% chance of a rally this week. The bears will see the rally as a bear flag. The bulls will see it as a bear trap and look for a bull breakout. Without a strong breakout below the May low, betting on the bears is not yet a high probability bet.
Traders can see the end of the day bar-by-bar price action report by signing up for free at BrooksPriceAction.com. I talk about the detailed Emini price action real-time throughout the day in the BrooksPriceAction.com trading room, and a 2 day free trial is available.
When I mention time, it is USA Pacific Standard Time (the Emini day session opens at 6:30 am PST, and closes at 1:15 pm PST). You can read background information on the intraday market reports on the Intraday Market Update page.


