Monthly S&P500 Emini futures candlestick chart:
October 5% correction before presidential election
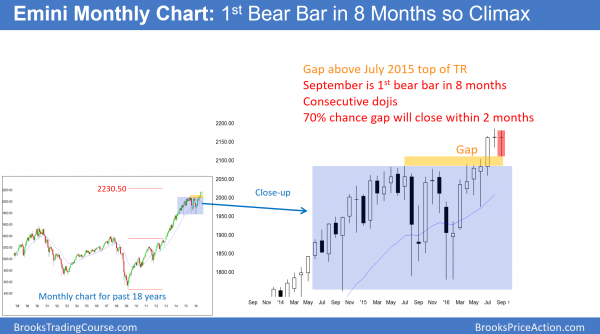
The monthly S&P500 Emini futures candlestick chart had a bear bar in September. After 7 consecutive bull trend bars, this therefore ends the buy climax.
After 7 consecutive bull trend bars, the monthly S&P500 Emini futures candlestick chart finally had a bear body in September. While it was only a bear doji, it marked the end of the buy climax. In the 18 year history of the Emini, there have been several other times when there were 7 consecutive bull trend bars. Each one was soon followed by about a 100 point correction. The odds therefore are that the Emini will fall about 100 points in October or November.
Because this month was a pullback, it is a High 1 buy signal bar for October. Since there are consecutive dojis, the buy setup is weak. This increases the chances that the breakout will not go far before failing. This is the monthly chart’s version of the wedge on the weekly chart. While a 3rd push up is likely, it will also probably lead to a reversal. Because the monthly chart is so bullish, the reversal will probably be minor. Yet a couple of months and 100 points down would be a major reversal on the daily chart.
Trading a possible 100 point correction
While the bulls have a 40% chance of a bull breakout to a new all-time high before the correction, the odds remain at 70% that the correction will come. As a result, bears will look to sell strong rallies over the next few weeks. They therefore will bet that bull breakout attempts will have disappointing follow-through.
Furthermore, they are confident that one of the reversals will fall for about 100 points. While some will try to swing trade every entry, many traders will take quick profits on most or all of their positions. Rather than risking many trades with no profit, they will try to take at least some profit on every trade.
The bull case
While perennial bull Tom Lee is regularly on Fast Money and he was on this week again saying that the correction is over, he is basing his prediction on fundamentals and not charts. The stock market has been in a bull trend for 7 years and many traders will continue to buy every pullback until the market is clearly in a bear trend.
Because that strategy has been very good for years, bulls have a good reason to be sanguine. They therefore expect that the current breakout will rally 300 points. This is the Measured Move up based on the height of the 2 year trading range.
The bulls see the past 2 months as a brief bull flag. They are aware that the rally from the July low is in a Parabolic Wedge and has had 2 legs up. Yet, the believe that there will be at least one more leg up.
The gap above the 2 year trading range
A gap is a space between support and resistance. A traditional gap is one example, and many traders believe it is the only type of gap. A trader who believes that is missing much of what the market it saying. The gap on the monthly chart is the space above the 2 year trading range and the September low.
Strong trends commonly create gaps. Yet, when a trend forms a gap in a trend that has gone 20 or more bars without a significant pullback, the odds are that the gap will soon close. It would therefore become an Exhaustion Gap.
The monthly chart broke above a 2 year trading range in a bull trend that has lasted about 100 bars. Hence, it is more likely that the gap will close than become a Measuring Gap.
How far can the rally continue before closing the gap? There is a 70% chance that the gap will close before the bulls reach their measured move target around 2400.
Weekly S&P500 Emini futures candlestick chart:
Wedge Top or Lower High Major Trend Reversal
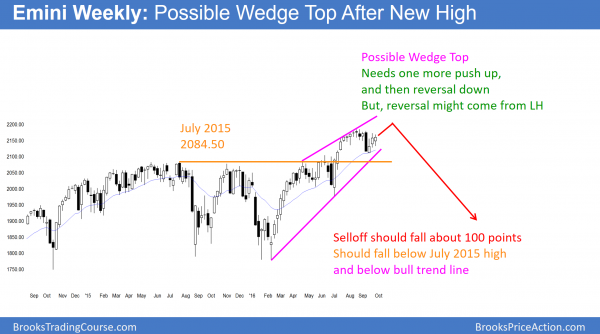
The weekly S&P500 Emini futures candlestick chart is forming a topping pattern. A reversal down from here would be a Lower High Major Trend Reversal, while a reversal from a new high would create a wedge top.
The weekly S&P500 Emini futures candlestick chart is in a strong bull channel. Yet, the channel has a wedge shape and it is follows a 2 year trading range after a 7 year bull trend. This rally is more likely the final leg before a correction than it is the start of a new leg up. Because traders know the risk of a top in this environment is high, they will look to sell a reversal down from a new all-time high. Hence, the reversal would create a wedge top.
Wedge top where the 3rd leg up is a lower high
As a result of traders looking to sell a new high, many traders wonder if the Emini might not quite reach a new high. Hence, many will begin to sell the rally to the new high, and plan to sell more on a reversal down from a new high. No one knows yet how many traders are doing this. If enough do it with enough volume, the Emini will turn down from below the old high. While the top would then be either a Double Top or a Lower High Major Trend Reversal, the forces would be the same as in a Wedge Top. Therefore, the top would be a type of Wedge Top, despite having a lower high on the 3rd leg up
Daily S&P500 Emini futures candlestick chart:
October correction from Wedge Bear Flag
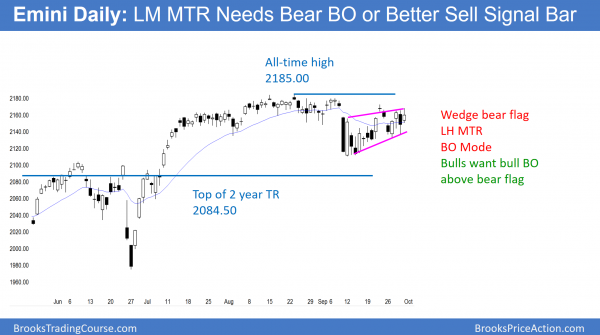
The daily S&P500 Emini futures candlestick chart is forming a Wedge Bear Flag after a strong selloff 4 weeks ago. The bulls want a bull breakout above the bear flag. The bears want a bear breakout. The Emini is therefore in Breakout Mode.
While the Emini daily S&P500 Emini futures candlestick chart had a double top major trend reversal from the August 15 and 23 tops, and a strong bear breakout on September 9, it has rallied since then. Yet, the rally has lacked consecutive big bull trend bars, and most of the bars are overlapping. This is more common when a rally is part of a trading range or a bear flag. While the bulls can still get a bull breakout above this bear flag, the odds still slightly favor the bears.
There are two reasons why the bears have an edge. The first is that the bear breakout was unusually big, and the bulls have failed to rally strongly above its high.
The importance of a tight trading range
The 2nd reason is arcane. Traders tend to dismiss tight trading ranges as noise. Only a lazy fool believes that the stock market has periods of noise.
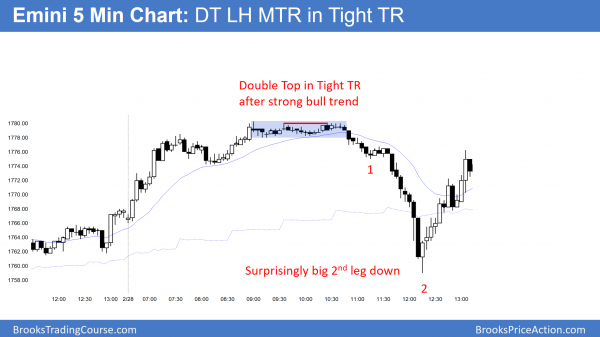
This is an example of a double top within a tight trading range on the 5 minute chart from 2014. There was a strong bull trend and then a tight trading range. After a small double top within the range, there was a bear breakout. The 2nd leg down was very big and fast.
When there is a double top reversal in a tight trading range, as there was in August, the Emini usually has 2 legs down. Furthermore, the 2nd leg is often shockingly big and fast. Was the September 9 bear day that 2nd, fast bear leg? It might have been. Yet, this is not clear. Therefore, traders must be open to the possibility that the selloff was the end of a complex 1st leg down. As a result, the current 3 week rally would be the pullback from the 1st leg. If this this the case, and the odds slightly favor this scenario, then the 2nd, shockingly fast, but brief, 2nd leg will come in the next few weeks.
Traders can see the end of the day bar-by-bar price action report by signing up for free at BrooksPriceAction.com. I talk about the detailed Emini price action real-time throughout the day in the BrooksPriceAction.com trading room. We offer a 2 day free trial.
When I mention time, it is USA Pacific Standard Time (the Emini day session opens at 6:30 am PST, and closes at 1:15 pm PST). You can read background information on the intraday market reports on the Intraday Market Update page.


