Market Overview: Nifty 50 Futures
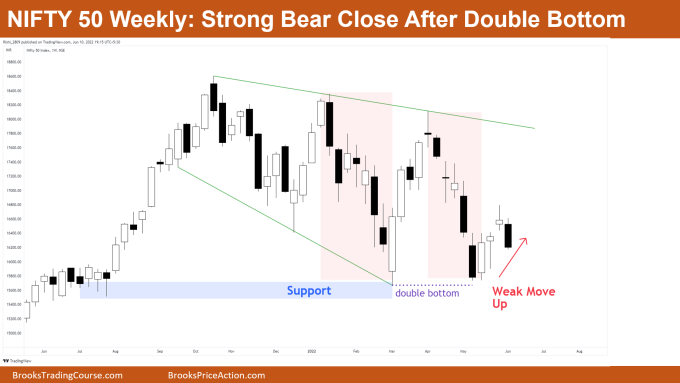
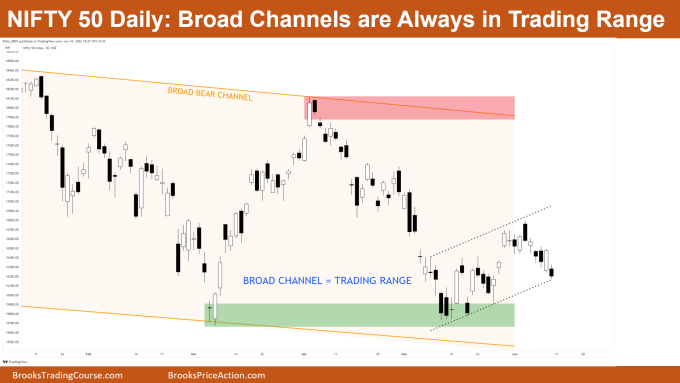
The Nifty 50 futures have given strong bear close after double bottom, but the best bears can get would be a trading range, so bulls would be again looking to buy near the trading range bottom. Nifty 50 on the daily chart is in a broad bear channel which are always a form of trading range. Currently near the bottom of the broad bear channel and also forming a nested broad bull channel.
Nifty 50 futures
The Weekly Nifty 50 chart

- General Discussion
- As discussed in the last weekend blog regarding the move up after double bottom is very weak, with higher chance that market would have a leg down before going up.
- This week’s market gave a strong bear close which disappointed bulls after the double bottom which suggests market can be in a tight trading range.
- As market formed double bottom bulls would be now looking to buy a High 1 (if strong bar) or a High 2 to try and take market up again.
- Always remember if bulls fail to drive the market higher, even after a High 2, this means that market is just in a wedge so expect bears to sell on a Low 2 or Low 3 as wedge
- Deeper into the price action
- Continuing the last weekend blog’s reversal discussion. We had discussed that market reversals depend on two factors:
- Number of bars in the reversal pattern
- Overall strength of bars in reversal pattern
- Now let’s discuss more with reference to above chart, as we know the bull reversal attempt was not enough to reverse the last leg down, which was very strong.
- So always remember that whenever you take a reversal trade, always compare the strength of trend with the strength of reversal. It was very clear that the bull leg up was really very weak with respect to leg down, thus not enough to reverse the trend (more points in the daily chart analysis)
- Continuing the last weekend blog’s reversal discussion. We had discussed that market reversals depend on two factors:
- Patterns
- Market still in the big expanding triangle and near a strong support and now formed a double bottom at support.
- Whenever you get double bottom / double top / wedge bottom / wedge top or any other reversal pattern near important support or resistance then entering on those patterns always gives you a higher probability.
- Pro Tip
- If you are a day trader and you find yourself every time entering on reversal setups (like wedges and channels) and just get trapped, then follow this…
- Make a rule that you would always take these types of setups only when market is near a higher time frame support or resistance. And if no support or resistance nearby, then you can always fade those reversal entries
- These kinds of rules work as filters to help avoid many bad trades, which in hindsight do not seem to be so obvious, but in real time can be too overwhelming. So always good to keep these kinds of rules in mind.
- You can even make more rules based upon your experience for trading breakouts and trading trends to help prevent you from entering bad trades.
The Daily Nifty 50 chart

- General Discussion
- Daily chart in a broad bear channel for a long time now, which is always a type of trading range. So you always have to trade it like trading range and buy low and sell high.
- Currently market near bottom of the ‘trading range’ so traders looking to buy the bottom of trading range.
- Deeper into price action
- As promised, talking more about the reversals… The reversals are divided into two main categories:
- Higher low major trend reversal.
- Lower low major trend reversal.
- So, when do the above two occur here? There are two answers:
- Higher low major trend reversal would be occurring when the 1st reversal attempt (or 1st bull leg in bear trend) is quite strong with reference to the bear trend.
- Lower low major trend reversal can happen when the 1st reversal attempt (or 1st bull leg in bear trend) is very weak with reference to the bear trend.
- As promised, talking more about the reversals… The reversals are divided into two main categories:
- Patterns
- Market forming nested broad bull channel within the bigger broad bear channel.
- As broad channel always acts like trading range, you need to buy low and sell high.
Market analysis reports archive
You can access all weekend reports on the Market Analysis page.

