Market Overview: Nifty 50 Futures
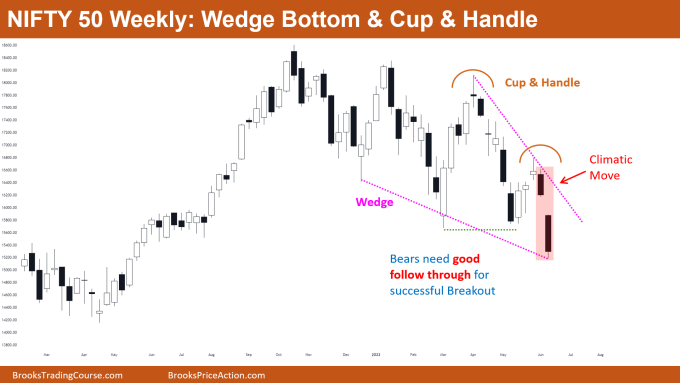
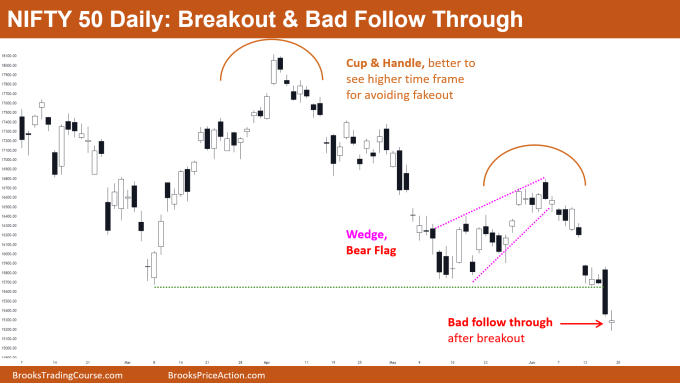
Nifty 50 wedge bottom with strong bear close this week. Overall structure is climatic and probably a halt expected next week due to wedge bottom. Wedge bottom usually has a double bottom breakout, so bears if want to continue the trend down they would need another bear close next week as well. Bottom line for weekly chart would be wedge bottom and cup & handle. On the daily chart Nifty 50 is forming big cup & handle and giving a breakout with bad follow through.
Nifty 50 futures
The Weekly Nifty 50 chart

- General Discussion
- For many weeks Nifty was showing much sideways price action and now confirming a wedge bottom.
- Wedge bottoms in bull trend generally work as bull flag. If you open higher time frame chart this would just be a bull flag in a long term bull trend and would probably continue higher.
- Climatic move down to the bottom line of the wedge, this increases the chances of failed breakout.
- Deeper into the price action
- I would emphasize that climatic breakouts late in trend usually have higher chances of failing. So does the above chart show.
- Very important thing you need to watch for on next week’s bar would be, whether bulls are buying at the low of this week’s bar. If next week’s bar forms a long tail and good enough body then bulls can reverse the market.
- In general, take a look at cup & handle. This is a big pattern and below this pattern there is a bull trend bottom (major support) which gives higher chances that cup & handle would not be able to reach its measured move, and would reverse before that.
- Patterns
- Wedge bottom on the weekly chart works as bull flag on higher time frame. Every time market gives a breakout of a wedge, the market would then often convert into trading range.
- If market gives a bull breakout of wedge bottom, then Nifty 50 would be passing through a very long-term trading range for the next 15 to 20 weeks.
- If at all you want to buy any stock or option then any buying should only be considered after you get at least 2 consecutive bull bars (to get always in long).
- Pro Tip
- Always remember every time you see a breakout of any pattern the most important thing buyers or sellers look at is follow through.
- If breakouts are not followed by good follow-through bars, then chances are higher that the breakout would eventually fail.
- So now if you are a conservative trader and do not want to enter on the breakout, you can always wait to enter on a failed breakouts. But this increases probability of losing trade opportunities.
The Daily Nifty 50 chart

- General Discussion
- Market gave a bad follow through to bear breakout of cup & handle. If market forms another (strong) bull bar, then bears would consider exiting their shorts. As discussed above the most important thing bears and bulls look for after a breakout is the follow through.
- Wedge top (pink line) worked like bear flag so possible measured move down if bears get good bear bar closing near low.
- Deeper into price action
- If you see last few bars in the daily chart, you would notice that the breakout bar was the biggest (in relative terms) bar. This is also called a surprise bar.
- When you see surprise bars like this, there is always the chance of a measured move down (not drawn in above chart).
- Market gave a cup & handle pattern with 2 consecutive bear bars, one of them closing near it’s low. This means that market has now converted into a sell the close trend and that is why we see the latest bar gapping down.
- Getting a bull bar in a sell the close trend often disappoints the bears, so some bears would be looking to exit above the bull bar.
- Patterns
- Big cup & handle pattern in the daily chart. Note that I mentioned preferring seeing big patterns like this (by big I mean number of candles in the pattern) in the higher time frame, as this would protect you from entering breakout traps.
- As promising as breakouts on daily chart are, they just may end up being a long tail on the weekly chart by the end of the week.
Market analysis reports archive
You can access all weekend reports on the Market Analysis page.

