Market Overview: Nifty 50 Futures
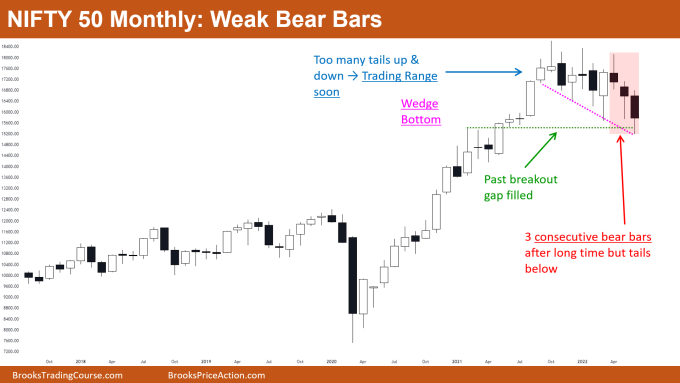
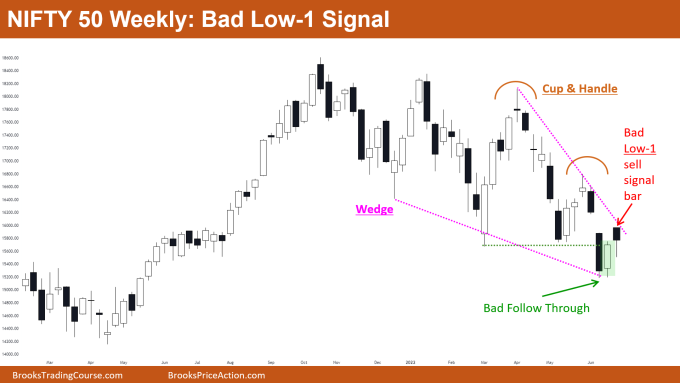
The Nifty 50 futures formed 3 consecutive bear bars after long time in monthly chart, but are weak bear bars which are not enough to convince more bears to short the market. Nifty 50 on weekly chart gave bad follow through to a High 1 bull bar closing near high (green box). This disappointed bulls but was also a bad Low 1 bear bar which means increasing trading range price action so probably sideways for a few bars.
Nifty 50 futures
The Monthly Nifty 50 chart

- General Discussion
- Increasing trading range price action after a very long rally (Covid-19 recovery)
- Market rallied up mostly in bull micro channel
- 3 consecutive bear bars but tails below, not many bears would be shorting below the bars
- These 3 consecutive bear bars decreased some bullishness in the above chart. But reversal bears also need to increase the bearishness of above chart. (Yes! Both are different. 🙂)
- Deeper into the price action
- When there are open breakout gaps in any chart, this means market can go much higher and you should not be selling.
- But this month’s market filled breakout gap and made chart less bullish (got that?).
- Market reverses when there are good bear bars to sell, but here bear bars are not good. So in this case bulls take profits and that is what creates these bear legs.
- So, what so these bears need to sell the market? Well, they need consecutive bear bars which are closing near their lows. And that is when market actually can likely reverse.
- Patterns
- Wedge Bottom seen in the above chart. A wedge is a type of channel… and as we know the market cycle (Trends → Channels → Trading Ranges).
- So next possible structure is a trading range. Also we are able to see increasing tails up & down, overall increasing the probability of trading range.
- Bottom line is that you can expect Nifty 50 to move in a sideways fashion for a few bars in future (but before that we need some more confirmation in lower time frames… we will see in weekly analysis section)
- Pro Tip
- Always remember that stronger the trend, the stronger is the reversal attempt needed to reverse the trend.
- Like above the trend up was very strong, as clearly seen there are very few bear bars in the bull trend.
- Due to this we need a very strong reversal attempt by the bears to reverse this trend. By strong I mean there should be strong consecutive bear bars closing near their lows (which is not the case here).
- Monthly chart reversal attempt is not strong, this means that the maximum bears can get is a trading range. If market starts forming consecutive bull bars in the direction of prior trend, then bulls would start buying again (as bears failed to reverse).
- Bottom Line is the stronger the trend, the stronger is the reversal attempt needed.
The Weekly Nifty 50 chart

- General Discussion
- Last week bulls got a very strong bull bar closing near high at wedge bottom
- This week’s market gave a bad bear close with tail below, which is less bearish but not bullish (hope you fully understood now!).
- Low 1 bear bar is not enough to drive the market lower as there would be many buyers below the bear bar than sellers.
- Bears who shorted cup & handle bear breakout would be exiting out of their shorts, which indeed would be creating possible bull leg in the coming days.
- Deeper into price action
- Last week was a very strong bull bar at very important level, so bulls bought the close of last week.
- This week gapped up which is good sign for the bulls. But then why did this week’s bar give us a bear body?
- When these types of contradictory questions arise in your mind, this is a sign that market is in trading range (confusion in the market).
- So, the best thing to do is wait until bulls deliver a strong bull bar.
- Patterns
- Failed bear breakout of cup & handle confirmed, soon bears would exit their shorts.
- Big trading range expected if market gives bull breakout of wedge.
Market analysis reports archive
You can access all weekend reports on the Market Analysis page.

