Market Overview: Nifty 50 Futures
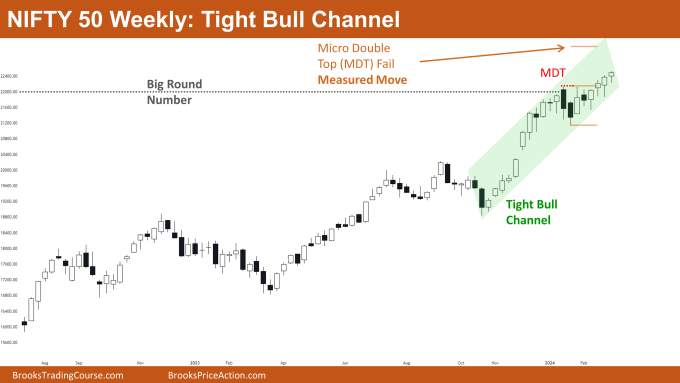
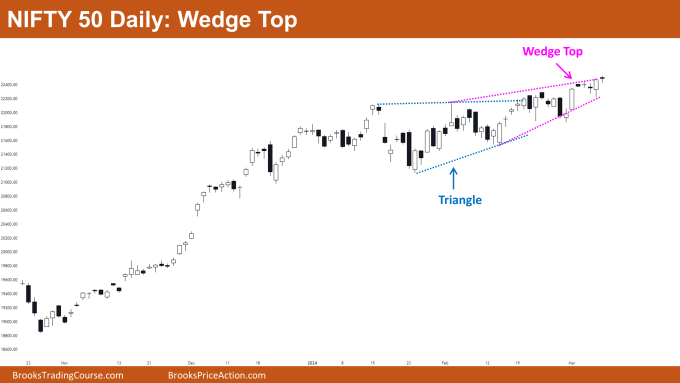
Nifty 50 Tight Bull Channel on the weekly chart. This week, the market closed with a bullish tone, although the body of the candle was small. However, there’s a noticeable decline in upward momentum on the weekly chart, reflected in the diminishing size of bullish bodies in recent weeks. Despite this, there’s still an impending target: the measured move of the micro double top fail pattern. Several bullish closes above the significant round number indicate no major resistances until the measured move level. On the daily chart, Nifty 50 is currently trading within a wedge top pattern, with small trading range bars observed during this week.
Nifty 50 futures
The Weekly Nifty 50 chart

- General Discussion
- The market is currently confined within a tight bull channel, indicating limited opportunities for sellers to profit near the highs.
- Therefore, it’s advisable for bears to refrain from selling until this tight bull channel transitions into a broader one. Once it becomes a broad bull channel, both bears and bulls can profit by selling at the highs and buying at the lows.
- Long-position holders should consider holding their positions until the market reaches the measured move level.
- Deeper into Price Action
- Recent market activity suggests a loss of momentum, with Nifty 50 forming bull bars with smaller bodies compared to previous bull bars in the trend.
- This loss of momentum could signal a potential upcoming trading range or a reversal attempt.
- Patterns
- A strong bear breakout of the tight bull channel increases the likelihood of a trading range rather than a reversal.
- The market has provided a measured move target based on the micro double top fail pattern, equivalent to the height of the pattern.
The Daily Nifty 50 chart

- General Discussion
- Nifty 50 is currently experiencing a breakout, so both bears and bulls should exercise caution before entering positions.
- In the event of a strong bearish bar formation, long-position bulls should consider exiting, as it could indicate an increased likelihood of a trading range.
- A successful bull breakout of the wedge top pattern could allow bulls to hold their positions until the market reaches the measured move based on the triangle pattern’s height.
- Deeper into Price Action
- Since trading near the significant round number of 22000, the market has exhibited considerable trading range price action.
- Following the bull breakout of the triangle pattern, there was a lack of significant follow-through, resulting in a wedge top pattern formation.
- With numerous bars forming within the trading range, the probability of a successful breakout on either side is approximately 50-50.
- Patterns
- Although the market experienced a bull breakout of the triangle pattern, the lack of substantial follow-through led to the formation of a wedge top pattern.
- For a successful bull breakout of the wedge top, bulls would require a strong breakout bar followed by consistent follow-through bars.
Market analysis reports archive
You can access all weekend reports on the Market Analysis page.

