Market Overview: Nifty 50 Futures
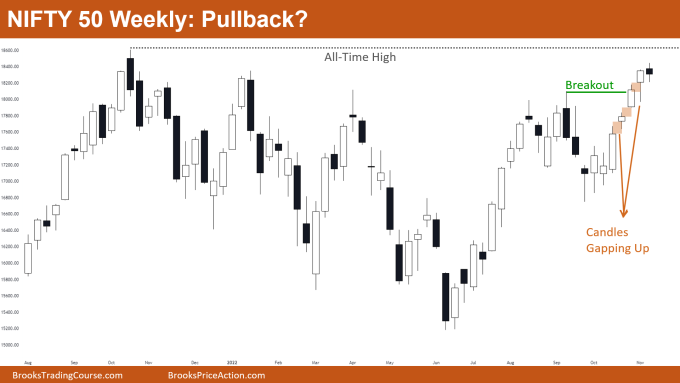
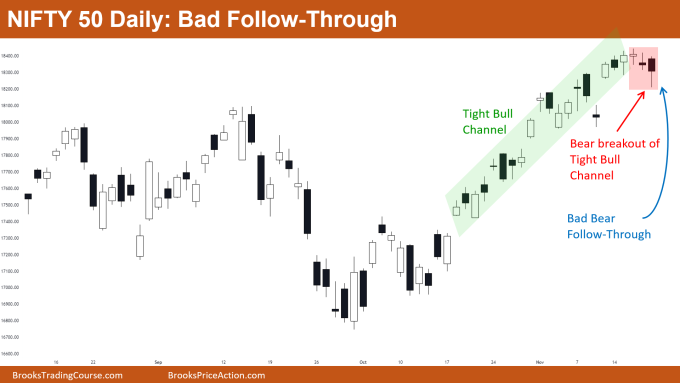
Nifty 50 possible pullback after the bull breakout of the swing high. The market gave a strong breakout of the swing high with 6 consecutive bull bars, and the market is still in 7-bar bull micro channel. Nifty 50 on the daily chart was in the very strong tight bull channel and now finally gave a bear breakout. Bears, however, did not get any follow-through and bears should not sell until they get strong consecutive bear bars.
Nifty 50 futures
The Weekly Nifty 50 chart

- General Discussion
- The market gave a strong bull breakout above the swing high but now it’s near the all-time high so some bulls would resist buying around these levels.
- Candles are gapping up (on open) and the market is still in a strong bull micro channel so bears should avoid selling.
- Bulls can buy
- At the market, or
- At the low of the current bar (by limit order), or
- At breakout level (by limit order), or
- At high of the current bar (by stop order)
- Note: Buying at these high levels increases the stop-loss (thus increasing risk on this trade), so traders should size their positions correctly.
- Deeper into the price action
- The market is in a bull micro channel which means the low of the 2nd bar never traded below the low of the 1st bar, after 6 bull bars the market formed a bear bar for 1st time in bull micro channel.
- As this is the 1st bear bar in this strong bull leg, there would be more buyers below this bar than sellers. This means there is a high probability that the market would get the 2nd leg up.
- Patterns
- Nifty 50 is near an all-time high, few bears would be waiting for strong bear bars to sell (assuming an all-time high would work as resistance).
- Some bulls would be buying at the market as the Nifty 50 gave a bull breakout and is in a strong bull leg.
- Few bulls would be waiting for a strong bull breakout of the all-time high.
- Pro Tip
- Ask these questions of yourself before selling:
- Is the market in a tight bull channel?
- See the last 5 bars, how many bear bars are there?
- How strong are the bear bars compared to bull bars (see last 5-10 bars)?
- Is the market forming overlapping bars recently? If there are increasing overlapping bars after a bull trend then this can be a sign of possible reversal.
- If I had to buy at this level why would I buy (put yourself in a contrary position)?
- Ask these questions of yourself before selling:
The Daily Nifty 50 chart

- General Discussion
- Nifty 50 is in a strong bull trend and gave a weak bear breakout of the tight bull channel.
- Bears would not be selling the market until they see consecutive bear bars or a big bear surprise bar, market needs to form big, strong bear bars to convince more bears to sell.
- As the Nifty 50 is in a strong bull trend, bulls know there is a very low probability that the market would reverse before giving the 2nd leg up (therefore bulls would be buying below bars).
- Deeper into price action
- In a strong bull trend like the above bulls generally place their limit orders below or at the low of candles or sometimes at swing lows.
- As there are more bulls below bars, this results in the formation of tails below bars (see the latest bar above).
- The market is forming a pullback, but the strength of this pullback is much less than the strength of the bull trend.
- So most bulls would assume that market would at least form the 2nd leg up before any kind of reversal.
- Patterns
- The market was in a strong tight bull channel and is now giving a weak bear breakout below the channel. This means the chances of reversal are quite low.
- Market cycle: breakout phase → tight bull channel → broad bull channel → trading range.
- As the market follows the market cycle, there is an increased probability that the market would now change from a tight bull channel to a broad bull channel.
Market analysis reports archive
You can access all weekend reports on the Market Analysis page.

