Market Overview: Nifty 50 Futures
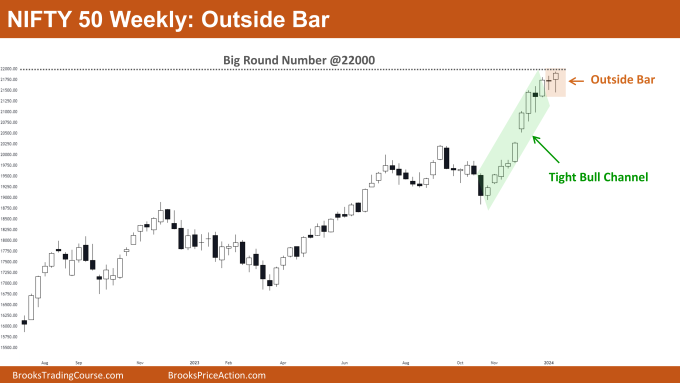
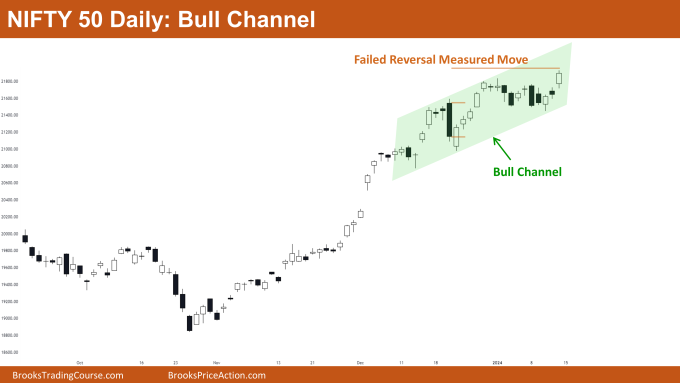
Nifty 50 Outside Bar on the weekly chart. The weekly chart indicates a strong bull close following the indecisive doji bar of the previous week. Nifty 50 maintains its position within a robust tight bull channel and is approaching the formidable big round number 22000, a significant resistance level. On the daily chart, the market persists within a bull channel, established after bears failed to initiate a reversal.
Nifty 50 futures
The Weekly Nifty 50 chart

- General Discussion
- Considering the market’s position within a robust bull trend, it’s advisable for bears to refrain from selling until the formation of strong consecutive bear bars.
- Bulls currently holding long positions should continue to maintain their trades, given the absence of strong signals indicating a reversal.
- Traders not in a position may contemplate buying at the top of the bull hammer bar, as the likelihood of a second leg up before a reversal is considerable.
- Deeper into the Price Action
- Despite the bears’ attempt to trigger a reversal with a small doji bar in the previous week, the lack of a bear follow-through bar this week suggests their failure.
- Over the last 10 to 15 bars, bears have been unable to produce a single strong bear close, significantly reducing the chances of a reversal.
- The proximity to the significant big round number 22000 indicates that traders should anticipate trading range price action on lower time frames in the upcoming week.
- Patterns
- The market reached the breakout gap measured move this week.
- The possibility of a bull channel emerging (transitioning from a tight bull channel) is higher if bears manage to secure a strong bear bar, as opposed to a reversal.
The Daily Nifty 50 chart

- General Discussion
- Nifty 50 continues trading inside a bull channel, offering opportunities for both bears and bulls to profit by selling near the high and buying near the low of the channel.
- Trading below the significant big round number 22000, which acts as a strong resistance, bears may consider exiting long positions if strong consecutive bear bars form, potentially indicating a higher chance of a trading range.
- Bulls not in a long position can wait for the market to revisit the bottom trend line of the bull channel.
- Deeper into Price Action
- The market achieved the measured move resulting from the failed reversal attempt by the bulls (highlighted by the big bear bar lacking follow-through).
- Nifty 50 transitioned from a tight bull channel to a broader bull channel. If bears manage to induce more trading range price action in the upcoming week, the likelihood of a trading range will increase.
- Patterns
- Nifty 50 on the daily chart aligns with the market cycle theory, which suggests distinct phases in price movement, including breakout, tight channel, channel, broad channel, trading range, breakout mode, and a repeating cycle.
- Currently situated in a bull channel phase, the market indicates a higher probability of entering a trading range in the coming weeks according to the market cycle theory.
Market analysis reports archive
You can access all weekend reports on the Market Analysis page.

