Market Overview: Nifty 50 Futures
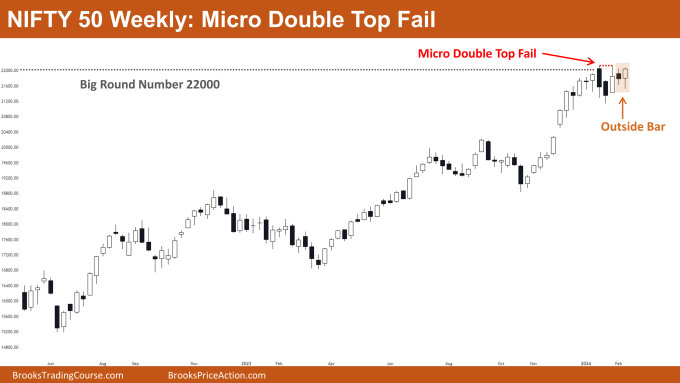
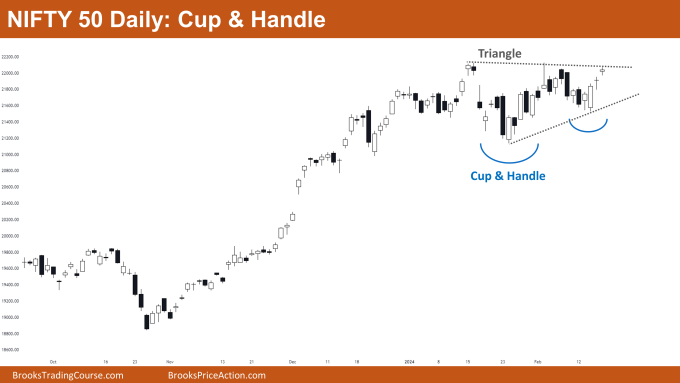
Nifty 50 Double Top Failure on the weekly chart. This week, the market concluded with a robust bull close, characterized by a bull bar closing near its high with a tail at the bottom. Despite attempts by bears to trigger a reversal with the formation of a micro double top pattern, they failed to garner follow-through momentum. Currently hovering near the significant big round number 22000, traders can anticipate trading range price action on smaller time frames in the upcoming week. On the daily chart, Nifty 50 is caught within a triangle pattern while also forming a cup & handle pattern, indicating a breakout mode with equal chances of success on either side.
Nifty 50 futures
The Weekly Nifty 50 chart

- General Discussion
- Nifty 50 persists in a strong bull trend, with bears failing to mount a convincing reversal attempt.
- Bears should refrain from selling until the market forms consecutive strong bear bars.
- Bulls already in long positions should maintain their stance, given the strong trend and high likelihood of a measured move up based on the outside bar pattern.
- Bulls considering entry should look to buy at the high of this week’s bull bar, holding the position until a robust reversal signal appears.
- Deeper into the Price Action
- Following the micro double top pattern, bears managed only a small bear bar without significant follow-through, indicating a lack of selling pressure.
- The tail at the bottom of the bull bar reflects bulls’ confidence, evidenced by buy limit orders at the low of the inside bar.
- Patterns
- Trading near the significant big round number 22000 suggests potential trading range price action.
- A strong close above the neckline of the micro double top could signal a measured move up based on the pattern’s height.
The Daily Nifty 50 chart

- General Discussion
- With the market ensconced within a triangle and forming a cup & handle pattern, both bulls and bears should await a breakout.
- Bulls holding long positions should maintain their stance, given the ongoing strong bull trend.
- Deeper into Price Action
- After numerous bars within the breakout mode pattern, the likelihood of a successful breakout on either side is roughly equal.
- As the trading range prolongs following a bull trend, the probability of a successful bull breakout approaches 50%.
- Patterns
- A robust bull breakout of the cup & handle pattern could increase the likelihood of a measured move up based on the pattern’s height.
- Failure by bulls to initiate a strong breakout could result in a trading range, given the prevailing strong bull trend and minimal chances of reversal.
Market analysis reports archive
You can access all weekend reports on the Market Analysis page.

