Market Overview: Nifty 50 Futures
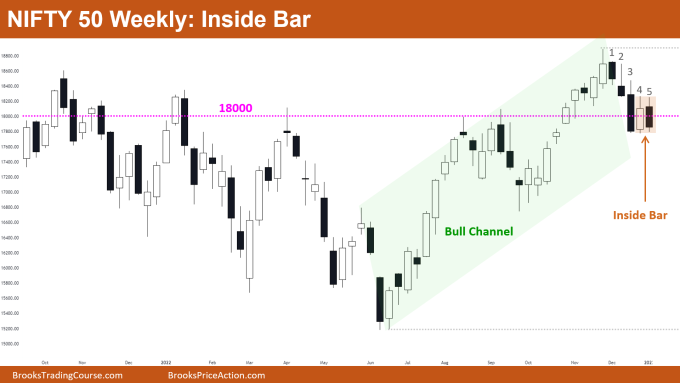
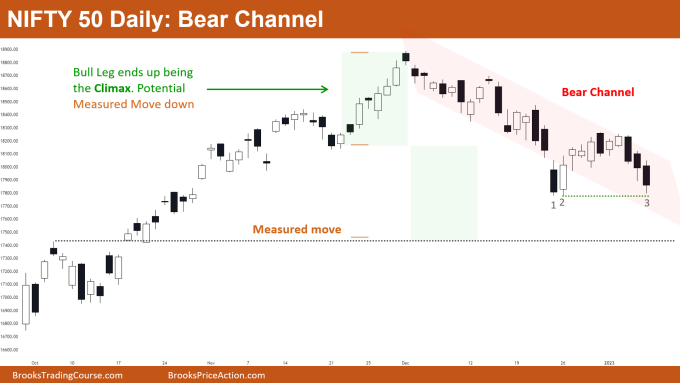
Nifty 50 inside bar pattern on the weekly chart and still trading near the bottom of the bull channel. Bulls and bears can expect some sideways price action for the next few bars. Nifty 50 is trading inside a bear channel on the weekly chart and can fall to a possible measured move down of the buy climax, but traders can expect sideways price action for the next few bars on the daily chart as well.
Nifty 50 futures
The Weekly Nifty 50 chart

- General Discussion
- The market is trading near the bottom of the bull channel, traders expect the trend resumption up as the bull channel is strong.
- Big round numbers generally act like a magnet (Rs.18000) and that is where the market is currently trading, so traders can expect some sideways price action.
- Deeper into the price action
- After 3 strong consecutive bear bars, bar 4 was a strong attempt by the bulls, but for a bull leg, the bulls needed a good follow-through bar after bar 4.
- Bulls got bad follow-through after bar 4, and bar 5 is a bear bar closing near low which would attract more bears to sell.
- After a strong bear leg (bar 1 to bar 3) there are higher chances that the market would form 2nd leg down, so many were waiting to short at the high of bar 4 with limit orders.
- Bears placed their limit orders below bar 4 high rather than placing at bar 4 high. This shows the eagerness of the bears to sell the market.
- Patterns
- Market forming an inside bar near the bottom of the bull channel. Bear bar is closing near its low which might attract many bears to sell below bar 5.
- As the last bear leg (bars 1 to 3) was strong, many bears expect 2nd leg down.
- But as there is support at the bottom of the bull channel, traders might not expect another big and strong bear leg.
- Pro Tip
- If you want to sell near the bottom of a trading range or bull channel then avoid selling with stop orders.
- Selling near the bottom with a stop order has the drawback of leaving little room for profit.
- Instead, sell with limit orders above weak bull bars or above strong bear bars.
- Doing this would improve the odds and your trade would get more room for profit.
The Daily Nifty 50 chart

- General Discussion
- The market is still trading inside the bear channel. The bear channel is tight and gives less room for the bulls to make a profit.
- Buy climax and measured move down expected by the bears, the measured move is also acting like a magnet.
- As there is a measured move target and the market is in a tight bear channel, many bears would sell at the low of strong bear bars or sell above weak bear bars.
- Bulls would not buy until they see some strong consecutive bull bars (as the market is in a bear trend)
- Deeper into price action
- The market gave an overshoot of the bear channel (on bar 1) but there is a 75% chance that the overshoot would fail and reverse.
- Due to that fact, aggressive bulls bought with limit orders at the low of bar 1 others bought above the following bar (bar 2).
- Bears who shorted below bar 1 knew that they were trapped once they saw the close of bar 2, so most of the bears exited above bar 2.
- The market is approaching support of swing low, if bulls succeed to form a bull bar, then traders can expect 1-3 bars of sideways price action.
- Patterns
- Buy climax measured move acting as a magnet.
- The market is trading inside the bear channel and now the market is approaching swing low support.
- Traders who shorted the close of bar 1, and did not exit on bar 2, may have exited their positions on bar 3, as seen by the tail at the bottom of bar 3
Market analysis reports archive
You can access all weekend reports on the Market Analysis page.

