Market Overview: Nifty 50 Futures
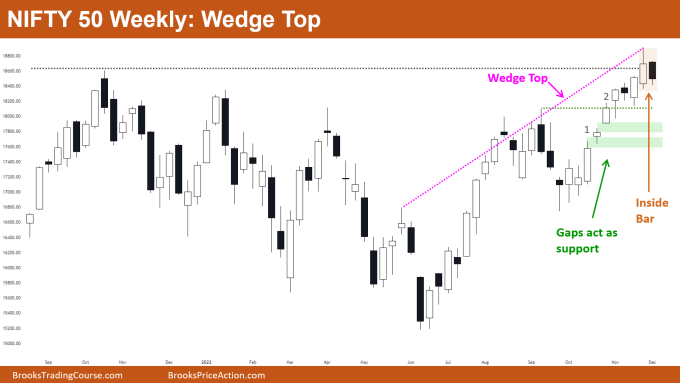
Nifty 50 futures wedge top formed on the weekly chart, and gave a bear close this week after giving a bull breakout above the all-time high level the previous week. This bear bar on the weekly chart is also an inside bar which can result in bulls losing interest to buy around current market levels.
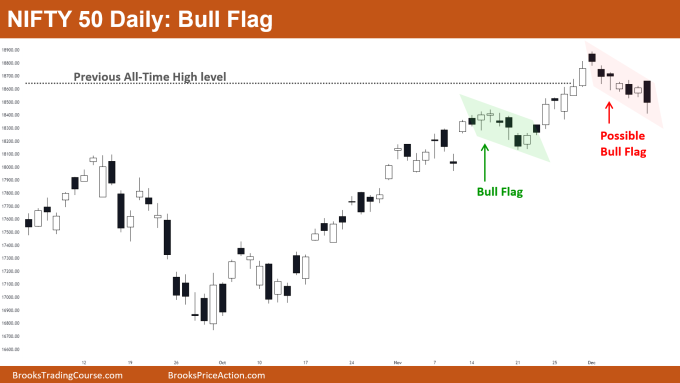
Nifty 50 on the daily chart is currently facing a pullback in this bull trend. The pullback seems very weak so there is a possibility of turning into a bull flag rather than a reversal.
Nifty 50 futures
The Weekly Nifty 50 chart

- General Discussion
- After giving a breakout above the all-time high, the market did not get any good follow-through to the upside and now the market formed an inside bar.
- Patterns like an inside bar, and inside-outside-inside bar form when there is confusion in the market. Here, the market formed an inside bar after a breakout which means the market can go sideways to down for a few bars.
- There are open gaps (look at bar 1 and 2 in the above chart) in the chart which acts as a magnet.
- Deeper into the price action
- The bull leg is very strong and the bear bar is inside the bull bar, so there is a low probability that the market would reverse from here.
- There are open gaps that act like magnets, and the market also failed to give a good follow-through upside, but the bull leg is very strong.
- So this creates confusion for both bulls and bears thus increasing the probability of the market going sideways to down for the next few bars.
- Patterns
- The market is forming a big wedge top after breaking above an all-time high. The bull trend is strong so there is a low probability of reversal.
- Many bulls would look at the bull gaps as an opportunity to buy with limit orders, so these open gaps would act as strong support.
- Some bulls would be buying at the high of the inside bar with stop orders, and some bulls would be buying at the low of the inside bar with limit orders.
- Pro Tip → When And How To Sell a Wedge Top?
- WHEN?
- Just because you know how to count 3 legs does not mean you would sell every wedge top. Before selling a wedge top you have to keep the following points in mind.
- Check how strong the wedge top is, how strong are the bear legs compared to the bull legs in the wedge top.
- Check whether there is an open gap in the wedge top, and check how strong the market gave a breakout above the swing highs in the wedge top.
- Is this wedge top occurring in a strong bull trend, or is this in a strong bear trend or a trading range.
- HOW?
- How to trade a wedge top depends on ‘WHEN’ you are trading a wedge top.
- If you are trading a wedge top in a strong bear trend, then you can sell near the upper line of the wedge top, or you can sell on the bear breakout of the wedge top.
- If you are trading wedge top in a trading range, then you should be selling the wedge top near the trading range top.
- WHEN?
The Daily Nifty 50 chart

- General Discussion
- After giving a bull breakout above an all-time high-level the market is in a pullback. There is not much selling pressure seen in this pullback.
- As the bull trend is strong and the pullback is weak there is a low probability of reversal, and a high probability of sideways to down or up.
- The bull trend generally forms many bull flags while moving up. This pullback is the deepest since the bull trend started, so this further increases the chances of sideways to down.
- Deeper into price action
- Always remember, the stronger the trend, the stronger should be the pullback (or reversal attempt) required to reverse the trend.
- The pullback in the above chart is not capable of leading to a bear trend. The last bull leg was strong so this increases the chances of a 2nd leg up before any kind of reversal.
- Some bulls who bought at the top would exit once the market reaches that level again, and traders would carefully watch the 2nd leg up (specifically the strength of 2nd leg up).
- Patterns
- Nifty 50 forming a bull flag (shown in red). Some bulls would buy on the bull breakout of this bull flag.
- Sellers who shorted on the bull breakout would not swing their position. This is because the market has not shown any strong consecutive bear bars since the fakeout (failed breakout).
Market analysis reports archive
You can access all weekend reports on the Market Analysis page.

