Market Overview: Nifty 50 Futures
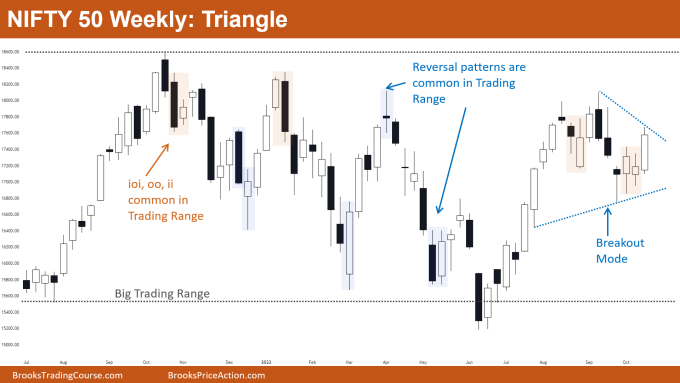
Nifty 50 futures triangle on the weekly chart is a breakout mode pattern. Traders would prefer to wait for the breakout before taking any position. The overall weekly chart is in a big trading range so traders should not prefer to hold trades for too long with big targets.
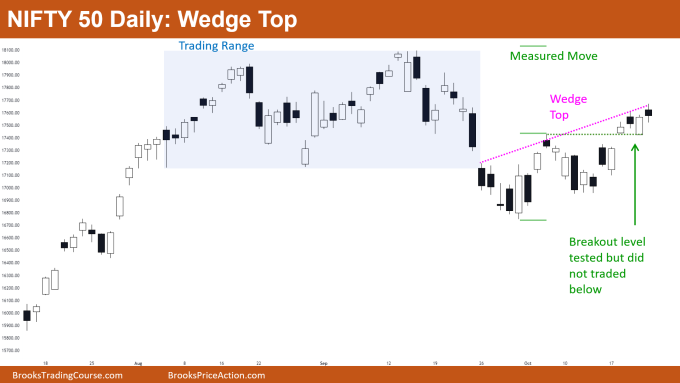
Nifty 50 on the daily chart is forming a wedge top after a bear breakout below a trading range, traders would prefer to sell on good bear bars as only a 25% chance of a successful bull breakout of a wedge top.
Nifty 50 futures
The Weekly Nifty 50 chart

- General Discussion
- The market is still in a big trading range due to which it is expected that the market would be forming trading range patterns (ioi, ii, oo…) and breakout mode patterns (triangle).
- The market is inside a triangle so traders would be waiting for a breakout before taking any trade.
- Deeper into the price action
- The market is near the top of the big trading range so bulls would not prefer to buy unless they get a strong breakout of the triangle.
- Bears would not prefer to sell unless they get strong consecutive bear bars, this is because the last leg up in the big trading range was very strong.
- This creates confusion for both bulls and bears and as we know confusion is the hallmark of the trading range (bottom line: you should wait for a breakout of the triangle).
- Patterns
- Market forming triangle which means there are 50-50 chances of a successful breakout to either side.
- But as the market is near the trading range top odds favor the bears if they get a bear breakout with consecutive bear bar.
- Traders plan for risk to reward greater than 1:1 as there are 50% chances, so for positive traders equation they need R: R > 1:1.
- Pro Tip
- EARLY SIGNS OF A TRADING RANGE
- Reversal patterns are common in a trading range, when you start seeing these patterns after a trending market then there is a high probability of the market converting into a trading range.
- Some reversal patterns in the trading range are
- Inside-outside-inside bar
- Outside-outside bar
- Inside-inside bar
- Inside bar
- Bad Follow-Through bars are common in the trading range. When you start seeing bull bars are often followed by bear bars (or vice versa) then this means the market is in a trading range.
- Once you start seeing these signs you need to change the way you trade i.e., rather than buying and holding (or selling and holding) the trade you need to buy low sell high scalp.
- EARLY SIGNS OF A TRADING RANGE
The Daily Nifty 50 chart

- General Discussion
- The market on the daily chart is forming a wedge top, therefore traders would prefer selling rather than buying.
- Bears should wait for a strong bear bar before selling.
- Bulls should avoid buying at this level as this is also the trading range top of the previous trading range (blue box).
- Deeper into price action
- After the bear breakout below the trading range (blue box) market did not get much follow-through to the downside, and now the market is forming a wedge top.
- On getting a bear breakout of this wedge top there is a high probability that the market would convert into a trading range again rather than a bear trend.
- Bulls were able to stop the market from trading below the breakout level, this is a sign of strength. Due to this, some bulls would expect a measured move up.
- Patterns
- Market trading near the top of wedge top but till now bears not able to form big bear bar.
- Bodies of the bear bar are getting smaller and smaller, so bears would resist selling this wedge top until they get a strong bear bar or consecutive bear bars.
Market analysis reports archive
You can access all weekend reports on the Market Analysis page.

