Market Overview: Nifty 50 Futures
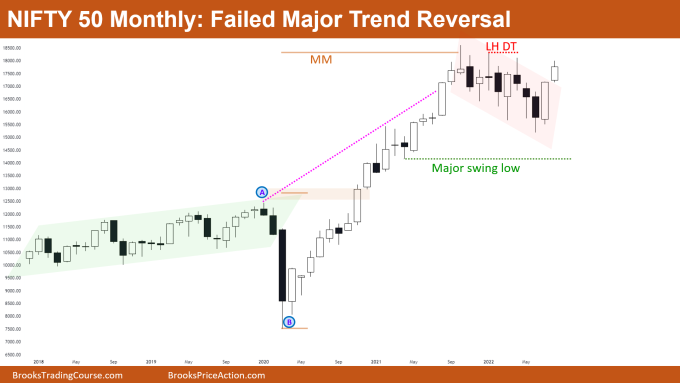
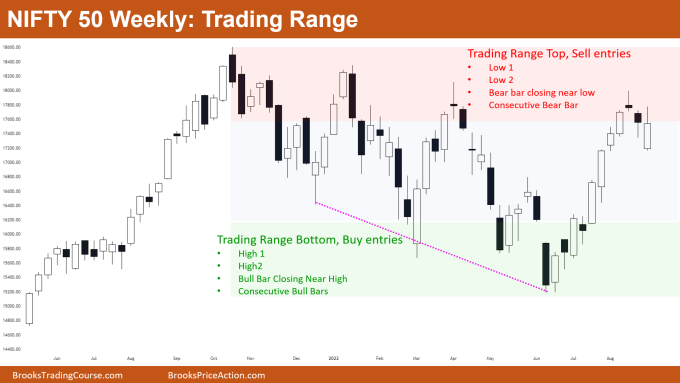
Nifty 50 failed major trend reversal on the monthly chart. Bears tried to reverse the bull trend by selling lower high double top, but failed to cause a reversal. Rather bulls are now trying to resume the bull trend, by forming consecutive bull bars closing near their high. Nifty 50 on weekly chart forming a big trading range, and current market near trading range top, so follow buy low sell high strategy rather than buying at this level.
Nifty 50 futures
The Monthly Nifty 50 chart

- General Discussion
- For the last several months Nifty 50 on monthly chart was forming too many trading range bars i.e., bars with tails below and above.
- Bulls and bears were getting small bodies and bad follow-through bars, which was an early sign of a possible trading range and not a reversal.
- Many bulls booked their profits at the measured move level, which caused the Nifty 50 to go sideways for a few bars.
- Deeper into the price action
- Once the market reaches an important resistance level (like the measured move on above image) then bulls stop buying above bars.
- This means bulls stop taking stop order entries, and rather they prefer buying below bars with limit orders.
- This is why the Nifty 50 has been forming too many trading range bars since it has reached the measured move target.
- Bears know that not many bulls would be buying above bars, so bears start selling above bars with limit orders.
- Due to this behavior of bulls and bears, the market shows trading range price action until bulls start buying above bars.
- Patterns
- Since 2020 market was in a strong bull trend which is a breakout phase and for the last 9 months Nifty 50 has been in a bear channel.
- As we know how the market cycle works (let me recap this for you “Trend → Channel → Trading Range → Trend…”), so as the current market is in a channel you can expect Nifty 50 to convert into a trading range for next few months.
- As the market is in bull trend, bulls look to buy strong bull closes and would try to resume the trend again.
- Pro Tip
- Stronger the trend, the stronger is the reversal attempt required.
- Look at the above chart, see how strong the bull trend was, and compare it with how strong the reversal attempt was, right from the measured move level.
- As you can notice, the bear leg was very weak as there were very few strong bear bars, and also very bad follow-through after each bear bar.
- Now take a look at the bear leg starting from bar A and compare the reversal attempt from bar B.
- You can notice how strong this reversal attempt was relative to this bear leg. There were strong bull closes and consecutive bull bars with good follow through.
- So before taking any reversal trade ask yourself “How strong is this reversal attempt compared to this trend?”
The Weekly Nifty 50 chart

- General Discussion
- Nifty 50 on the weekly chart has been in a broad bear channel for a long time, so according to the market cycle, there was a high probability of a trading range ahead (which is now confirmed).
- Nifty 50 in a strong bull leg, so 60% chances of at least 2nd leg up before any kind of bear reversal.
- Since the market reached the trading range top, no strong bear bars are seen, this increases the chances of 2nd leg up.
- Deeper into price action
- When 2nd leg up has a higher chance of showing up then bulls look to buy below bars with limit orders.
- That is why you can see bars forming tails below, and no selling is seen below bars.
- When near to trading range top, bulls avoid buying above bars, and rather bears would be looking to sell above strong bull closes with wide stops.
- Patterns
- Currently, the Nifty 50 is in trading range, so the only strategy you should follow as a swing trader is to buy low sell high.
- You have many ways to enter near trading range top, some of them are:
- Low 1 below a strong and big bear bar,
- Low 2 probably after a strong bear leg for high probability, and
- Bear bar closing near low, or on consecutive bear bar.
- Any of the above entries are valid, it depends on you how much probability you want for your trades, or how much risk to reward you prefer according to your personality.
Market analysis reports archive
You can access all weekend reports on the Market Analysis page.

