Market Overview: Nifty 50 Futures
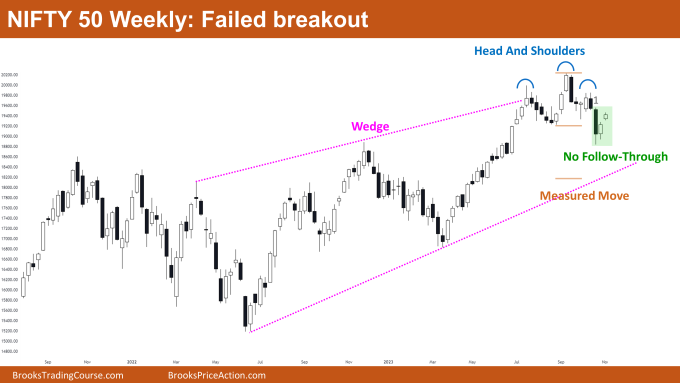
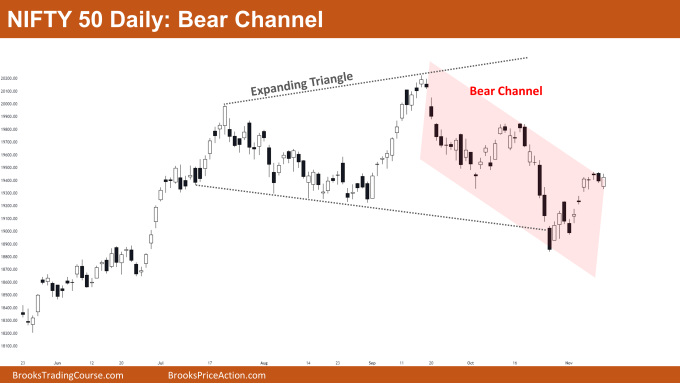
Nifty 50 Failed Breakout on the weekly chart. This week’s market produced a tiny bull close with a tiny body following two strong bear bars in a row, increasing the likelihood of a second leg down. A bear breakout of the head and shoulders top was also shown on the weekly chart, but the bears were unable to provide a follow-through lower, and as a result, the breakout failed. On the daily chart, the market is creating the expanding triangle pattern and the Nifty 50 is trading inside a bear channel.
Nifty 50 futures
The Weekly Nifty 50 chart

- General Discussion
- Even after the strong bear breakout, bears should refrain from shorting the market because they were unable to get a follow-through.
- Because the bears who would have sold the market at the close of bar-1 are now trapped, there is a greater likelihood of a second leg up.
- Thus, bulls are able to purchase at the peak of the most recent bull bar. Note: Bulls should treat this trade as a scalp (book a quick profit or loss) and not as a swing, placing a stop at the closest swing low (in the chart above, that would be the low of bar 1).
- Deeper into the price action
- Bears did not provide a strong follow-through even after the powerful bear breakout of the top of the head and shoulders.
- Rather, bulls managed to create two bull bars that closed close to their peaks. A trading range is indicated by strong bars that are followed by weak bars, or bars that are pointing in the opposite direction.
- Patterns
- The Nifty 50 is currently trading within a large wedge pattern. Since the wedge’s trend lines are now contracting, traders should anticipate trading range price action until the market breaks out of the pattern.
- The likelihood that the market will make a head-and-shoulders measured move is high if the bears are able to break the bar-1 low and form a strong bear close below the low.
The Daily Nifty 50 chart

- General Discussion
- The market is trading inside a broad bear channel, which suggests that by buying close to the bear channel’s low and selling close to its high, both bulls and bears can profit from this pattern.
- The market is currently trading close to the broad bear channel’s high, so bulls should avoid making purchases there, and bears should look to sell on strong bear closes.
- Bears should wait for a follow-through bar before selling; they shouldn’t start selling as soon as they spot a bear bar.
- Deeper into price action
- The bears made an initial attempt to reverse the bull leg but were unable to do so when they got close to the upper trendline of the bear channel.
- The likelihood of a bull breakout will rise in the coming week if bears are unable to reverse this bull leg on their second try.
- Patterns
- The likelihood of a successful bull breakout from a bear channel is typically 75 percent, compared to a 25 percent chance of a successful bear breakout.
- The market is also trading inside an expanding triangle; traders should purchase near the triangle’s base and sell near its peak in order to profit from this trading pattern.
- Take note: As the expanding triangle widens, the likelihood that the market will reach the other side falls.
Market analysis reports archive
You can access all weekend reports on the Market Analysis page.

