Market Overview: NASDAQ 100 Emini Futures
The NASDAQ Emini futures market has been going sideways for the past two weeks around the bottom of the trading range from early November.
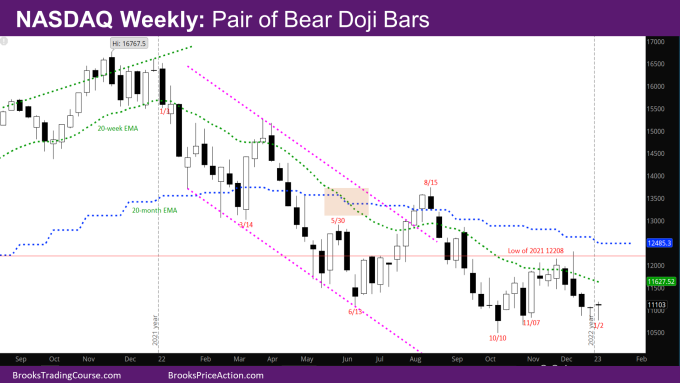
Given the pair of weekly bear doji bars over past two weeks, the market will likely make at least a small second leg down for the strong leg down in December.
NASDAQ 100 Emini futures
The Weekly NASDAQ chart

- This week’s candlestick is the second bear doji bar with a big tail below.
- The positive for the bulls is that they have stopped the bears from having strong bear bars for two weeks in a row.
- The positive for the bears is that the bars are doji bear bars following strong bear bars and not bull bars. So likely sellers above for a 2nd leg following the strong leg in December.
- As mentioned before, bulls will need a good signal bar around the bar from the week of 10/10. The market is down around that level. Can the bulls create a good bull buy signal bar in the next few weeks?
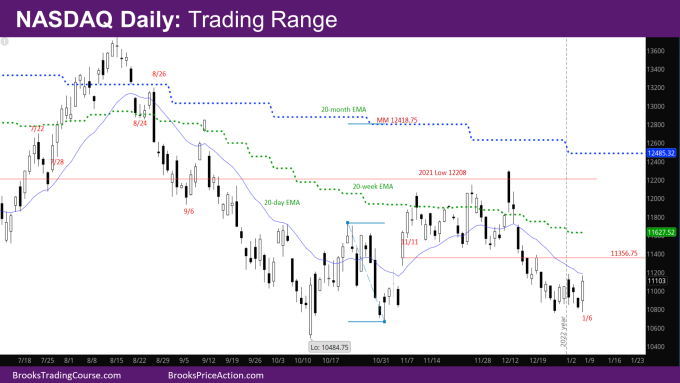
The Daily NASDAQ chart

- Friday’s NQ candlestick is a bull trend bar with a big tail below and a small tail above closing just below the exponential moving average (EMA).
- Friday made a new low for the week, but also reversed most of the week up.
- Big bull bars just below the EMA will usually attract some sellers.
- The market has been mostly sideways for the past two weeks.
- The market will likely continue to be in a trading range for the next couple of weeks, with the high between 11356.75 (the high of the gap that closed on the way down) and the weekly EMA at 11627.5.
- The bulls would like still like the market to be above the right shoulder low so that they still have a chance at the Measured Move (MM) target of the Inverse Head and Shoulder (IVH).
Market analysis reports archive
You can access all weekend reports on the Market Analysis page.

