Market Overview: NASDAQ 100 Emini Futures
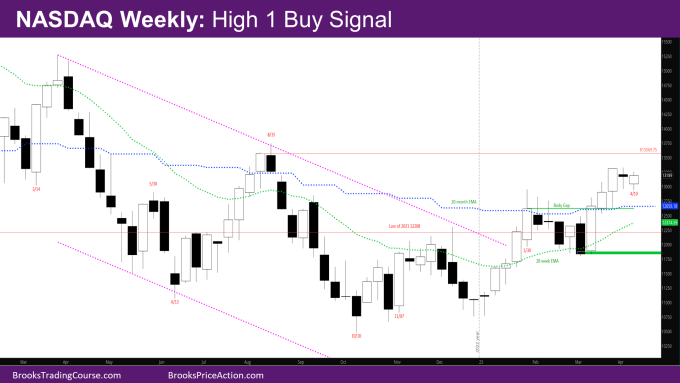
The NASDAQ Emini futures market triggered the weak doji sell signal bar of last week, ending as a small Nasdaq High 1 buy signal bull reversal bar with small tails above and below.
Bulls hope this is a reversal for another leg up. Bears would like the market to go more sideways in the hopes of increasing their chances of a pullback.
NASDAQ 100 Emini futures
The Weekly NASDAQ chart

- There is not much new this week.
- As was likely, bulls bought the weak sell signal bar of last week.
- This week is a Nasdaq High 1 buy signal bar.
- The next bull target is the close of Week of 8/8 at 13569.75 – the last bull bar of the micro channel up in August. That was a reasonable buy the close bar, and there are trapped bulls up there.
- The market is close enough to this target that it should reach it.
- The 2nd leg up since March is also a 3 bar bull micro channel (low of each bar higher than prior bar low) which means there will likely be another leg up after a pullback even if for one bar.
- There is also a body gap created by the week of 1/30 – There has not been a bear close after the market broke above the close of 1/30 that overlaps with the body of 1/30.
- If the market goes sideways for a few weeks, bears will try to get a leg down like they did at the end of the first leg up in early February.
- The first target for bears will be to close the body gap by going below close of 1/30 – 12613.25
- As strong as the move up since October, since the reversal did not start with a bull signal bar, this is still likely a minor reversal, and the market may have to test back down again even if after 6-10 months.
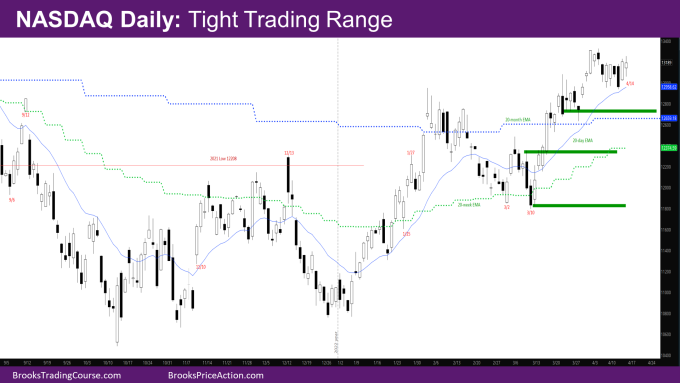
The Daily NASDAQ chart

- Friday was a small bull bar with tails above and below.
- This week was a tight trading range (TTR).
- While Monday was a bull bar, Tuesday and Wednesday sold off to below Monday, where buyers came in.
- Thursday and Friday were bull bars closing near the high of the range.
- Most of the daily bars this week are trend bars.
- The market may be going sideways for the exponential moving average (EMA) to catch up.
- When there is a pullback, some of the possible targets and areas of support are shown in the chart.
Market analysis reports archive
You can access all weekend reports on the Market Analysis page.

