Market Overview: NASDAQ 100 Emini Futures
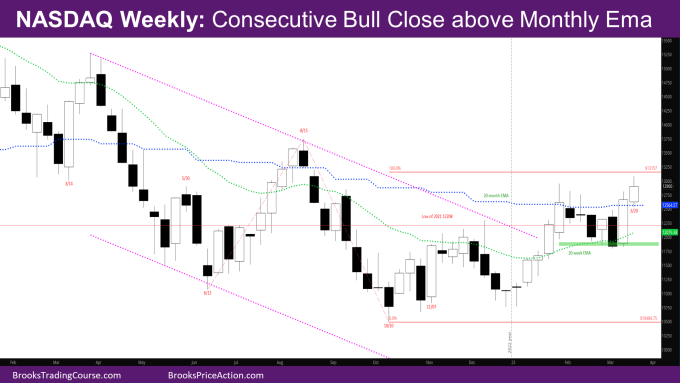
The NASDAQ Emini futures market had a bull follow-through bar to last week and first consecutive weekly close above the monthly exponential moving average (EMA). This is the first time since 2021 that there are two consecutive weekly bull close above monthly EMA.
The market went above the February month high this week. The monthly chart so far is a good-looking bull bar closing around the February high. Next week is the last week of the month. The question is whether the month can close above the February high, or will it close below the high with a tail above? More likely the latter to disappoint the bulls.
NASDAQ 100 Emini futures
The Weekly NASDAQ chart

- This week’s candlestick is a trend bull bar with a tail above and a small tail below.
- It is a much smaller bar in comparison to last week’s bull bar.
- The week also did not close above the high of the week of 1/30 – the previous high looking to the left.
- This shows that the bulls are still not as strong.
- Bears will try to create a bear reversal bar next week to also make the monthly bar less bullish.
- Now that the February high target has been met, the other bull targets that have been mentioned in prior reports are:
- Leg1/Leg2 target at 13157 where Leg 1 is the move up from June to August and Leg 2 is the move up from October.
- Close of Week of 8/8 at 13569.75 – the last bull bar of the micro channel up in August. That was a reasonable buy the close bar, and there are trapped bulls up there.
- Since bulls did not have a good signal bar in January or October, the reversal up since January is still likely a minor reversal, and bulls will need a good signal bar around the bar from the week of 1/2.
The Daily NASDAQ chart

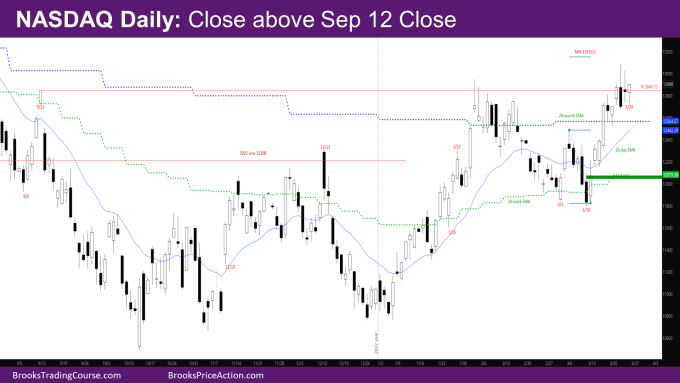
- Friday’s NQ candlestick is a bull bar with a tail below.
- The market also closed above the prior high close of 9/12/2022. It reached that early February but did not close above, and then pulled back for a month.
- While this is technically not a swing high, it’s an important milestone on the way to the swing high close of 8/12/2022.
- The week started with a couple of bull days going above the monthly EMA.
- Wednesday was a big outside down day, and Thursday and Friday were inside Wednesday.
- Thursday was a doji sell signal bar with tails above and below.
- Friday triggered the sell signal and closed on its high.
- Just like the bad sell signal bar on the monthly chart, the market will try to take out the stops above Thursday and Wednesday.
- This essentially puts the market in breakout mode (BOM) – as in one should wait for a breakout and follow-through above or below the Wednesday bar.
- Since there are targets above, the market could try breaking out above, make those targets and then fall back into this range. This would then become final flag.
- As mentioned last week, the signal bar for the reversal up last week is the big bear bar of 3/10. If one goes back and sees all the reversals in the past year that started with bad bear bars, they have been minor, and those bars have been retested.
- The bar of 3/10 is around the weekly EMA, and if it gets retested, the weekly EMA will likely act as support as it has done in the past month.
Market analysis reports archive
You can access all weekend reports on the Market Analysis page.

