Market Overview: NASDAQ 100 Emini Futures
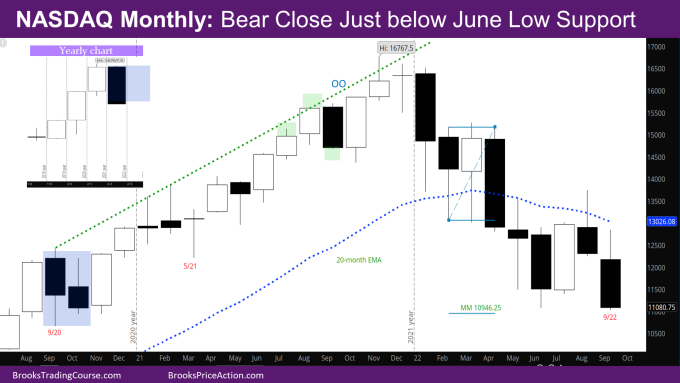
The NASDAQ Emini futures September monthly candlestick is a bear trend bar with close below June Low support, with a tail on top. It is a good entry bar following the Low 1 sell signal bar of last month.
The market closed just below the June low. By closing below the prior low, the bears have shown strength. There is also only one good bull bar in the last 6 months.
Next month is important to decide whether the market goes down much more or goes sideways. If next bar is a trend bar closing far below this month low, the market will likely go down more. If next month is a doji bar, or a bull bar, it will signify a failed breakout and market will likely go sideways and try to make a Low 2 sell signal at the exponential moving average (EMA). This could take the rest of the year to develop.
Either way, the market will have to go below this month’s low to see where buyers come in.
NASDAQ 100 Emini futures
The Monthly NASDAQ chart

- This month’s candlestick is a bear trend bar with a tail on top.
- The case for sideways/tight trading range for next few months –
- The June, and July bars are big sideways bars – In a trading range, big bars attract sellers at the top and buyers at the bottom.
- The market likely will not go down much below July – as July is a big bull bar, and the market went sufficiently above July in August, so buyers somewhere below July.
- The August sell signal is a Low 1 sell signal bar, so bears will likely wait for a Low 2 sell signal bar at the EMA to sell more.
- As mentioned last week, the market has been in an expanding triangle since May which would imply the market should reverse from below the June low.
- The case for a falling market for next few months –
- There has been only one good bull bar in the last 6 months.
- While the NQ has reached the bottom of its bull spike from November 2020, the ES (S&P 500 Index futures) has yet to reach the bottom of its bull spike in November 2020.
- If the ES sells down to that level, the NQ may have to tag along for the ride.
- The best path for the bulls is to get a good second entry long after a few sideways bars.
- Since we are in the final quarter of the year, I would like to revisit what is possible for the rest of the year and next year. This was first mentioned in the March monthly report – which is that this year and next year could be sideways/inside bars like September-October 2020 on the monthly chart, setting up a breakout mode on the yearly chart in 2024.
- See the inset yearly chart. At this point the year is a big bear bar. The market could rally and put a tail at the bottom by the end of the year, then rally sometime next year and sell off to make 2023 look like the October 2020 month inside bar.
The Weekly NASDAQ chart

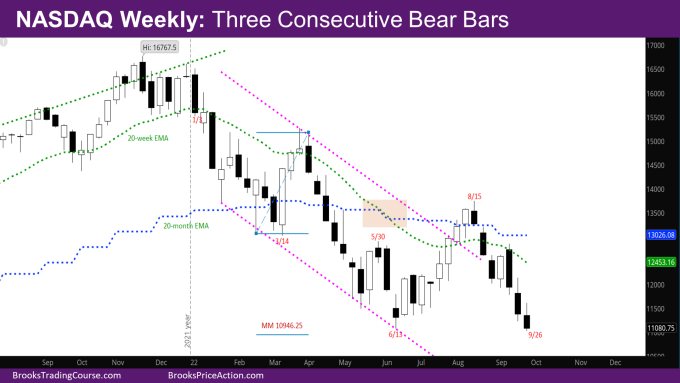
- This week’s Nasdaq Emini candlestick is a bear trend bar closing at its low and a tail at the top.
- The market closed just below the prior low of the year (low of 6/13).
- This week’s body is smaller than last week’s, signaling slowing momentum. At the same time, there are no overlap in bodies in the past two weeks.
- The positive for the bears this week is that they closed on the low. The positive for the bulls is that the market is still around the prior low, so the bears still need to do more in the next two weeks to show that the market will go down a lot more.
- The rest of the analysis from last week is still applicable.
Market analysis reports archive
You can access all weekend reports on the Market Analysis page.

