Market Overview: NASDAQ 100 Emini Futures
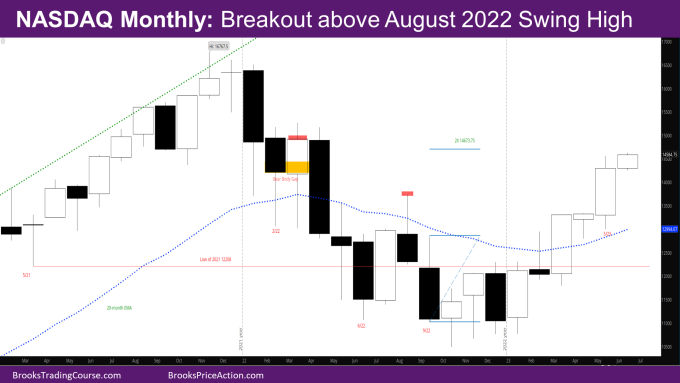
NASDAQ Emini futures May monthly candlestick is a big bull trend bar with small tails, and breakout above August 2022 swing high and March high. At this point, the bar is also far above the monthly exponential moving average (EMA).
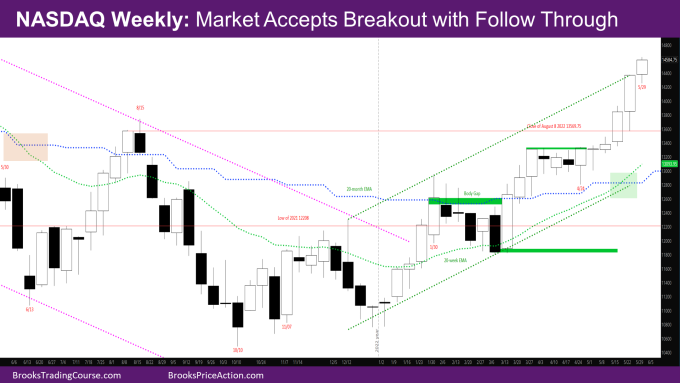
This week closed as a non-climactic bull trend bar after the two big weekly bull bars last week. This shows that the market is accepting the big bull bars and not treating them as climax yet.
NASDAQ 100 Emini futures
The Monthly NASDAQ chart

- The May month bar is a big bull bar relative to March.
- The bulls needed a strong follow-through bar to try and convert the market to be Always in Long (AIL).
- With May, they may have done that.
- Bulls will need a non-climactic bull bar for June as a follow-through bar to May to confirm that May wasn’t a climax bar, and that the market can go higher.
- Since May is such a big bar, June will likely be a disappointing bar for the bulls.
- The market has gone far above the August swing high that bears who may have sold the August high in hopes of a double top are trapped.
- In other words, if the market were to pullback, it will likely find buyers at the August high and hence act as temporary support.
- Back in January, the report had shown a target of 14673.5 based on 2x the risk of buying below the September bar. The 2x target was based on a 40% probability of success. This target is now less than 100 points away and should be reached.
- The next target for the bulls is the March 2022 close.
- May also has a small overlap with the bear body of February 2022. The bear body gap was created when April and May 2022 broke below the bear body of February 2022, and there has not been a bull close since that overlaps with the body of February 2022.
- If June does not close as a strong bull bar, the body gap will still largely be open and something to keep an eye on for the next few months.
- If the market goes sideways for the next few months, bears may sell more if the gap continues to stay open.
- The market has also retraced more than 50% of the entire move down.
The Weekly NASDAQ chart

- This week is a small bull trend bar closing near its high with a small tail at the bottom.
- Even though it’s a small bar compared to last week, it actually is a good sign for the bulls – it indicates that the market is accepting the big bar of last week, and likely there are trapped sellers at the highs of last two weeks.
- As mentioned before, traders sell strong bull bars and buy strong bear bars because they usually pullback.
- Instead, the market continued to go up last week and this week and has created a layer of support around the high of the last two weeks.
- The next bull target is the close of 3/28/2022 at 14831.
- The market is at the high of a channel as shown on the chart.
- As a result, there should be a pullback in the next few weeks.
- If bulls can keep the gap open with August high, the possible measured move target of August 2022 to December 2022 low would put the market back near the all-time high.
- As of now, bears have not done much.
- There have been no consecutive bear bars since December of 2022.
- There has not been a close below a prior bar since early March.
- The first bear target is to close the gap with the August high, and the highs of the trading range of April.
- There is also a body gap created by the bull bar of 1/30 – There has not been a bear close that overlaps with the body of 1/30 after the market broke above the close of 1/30.
- The next target for bears will be to close the body gap by going below close of 1/30 – 12613.25
Market analysis reports archive
You can access all weekend reports on the Market Analysis page.

