Market Overview: NASDAQ 100 Emini Futures
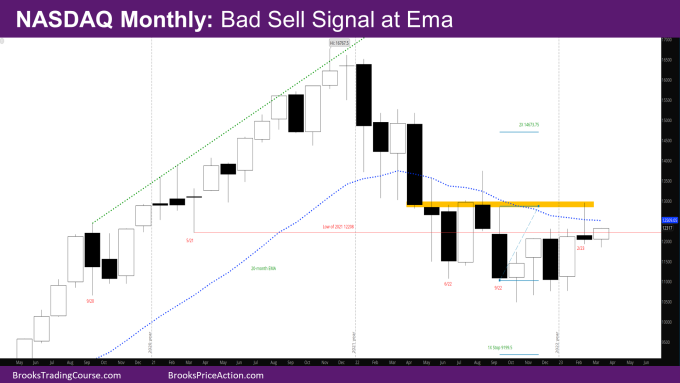
February Nasdaq Emini candlestick is a bear doji bad monthly sell signal bar with a big tail above, and a small tail below, at the monthly exponential moving average (EMA).
This is a weak sell signal and acts more as a trading range bar – buyers below and sellers above. The market triggered the sell-signal on the first day of the month and then reversed up strongly.
NASDAQ 100 Emini futures
The Monthly NASDAQ chart

- The weak sell signal bar acts like a first pullback in a micro channel that is usually bought.
- The bull micro channel makes it likely that there will be a 2nd leg up.
- Last month’s report had mentioned that if February has a significant tail above, it could do the opposite of what happened in May-September.
- This could mean March could end up as a bull bar closing around the February high, and then the bears could try selling again in April or May.
- If instead March, April end up as bear bars, there will likely be buyers around the lower half of January.
- The bull targets mentioned in last month’s report and shown on the chart are still valid.
- If February had closed far above the monthly EMA, the upside target shown on the chart would have been more probable.
- The market was back in the area where there has been very little body overlap since the big bear bar in April 2022 – IOW, the bars after April have little body overlapping with the body of April. That has been a sign of strength on the part of bears. The bulls could not close that body gap and the body gap still remains.
The Weekly NASDAQ chart

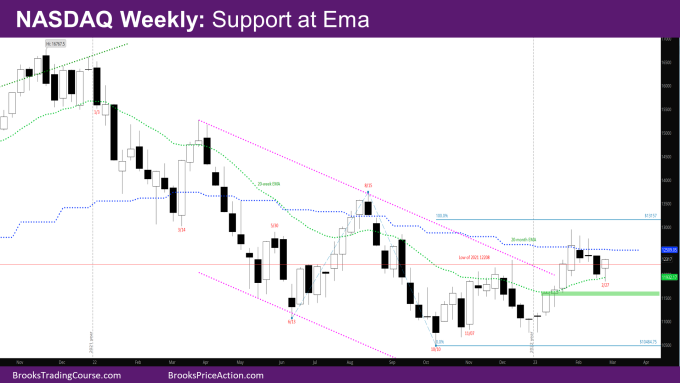
- This week’s candlestick is a bull reversal bar at the weekly EMA.
- Last week started the pullback in the bull micro channel that started in January.
- The leg up from January is strong enough that there should be another leg up after the pullback.
- If bears could have produced a pair of strong bear bars closing on their lows, bears would sell assuming the monthly EMA is working as resistance.
- Given the strong bar last week, bears needed a strong follow-through bar this week to convince sellers that there will be more down.
- That did not happen. The weekly EMA acted as support.
- This means even if there is another leg down, bulls will buy it.
- If there is a leg down, the market should find support at the high of 1/9 around 11600. It was a sell at the weekly EMA for a possible 2nd leg down back, so a test target.
- Now the question is – will bulls get a follow-through bar next week? Or will bulls who bought the EMA scalp out which means next week could be bear bar or a bull bar with a tail above.
- Since bulls did not have a good signal bar in January or October, the reversal up in January is still likely a minor reversal, and bulls will need a good signal bar around the bar from the week of 1/2.
Market analysis reports archive
You can access all weekend reports on the Market Analysis page.

