Market Overview: NASDAQ 100 Emini Futures
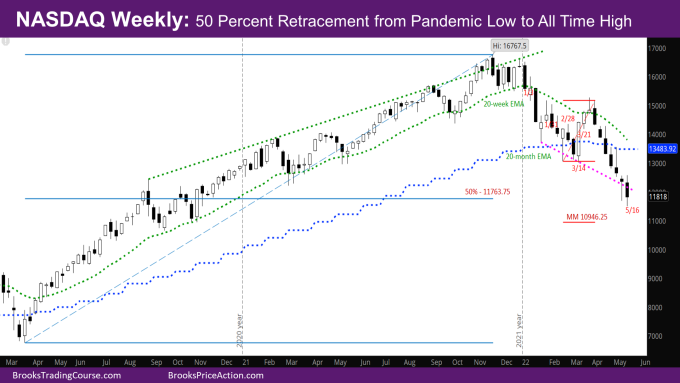
This week’s Nasdaq Emini candlestick is an outside bear bar with a close above last week’s low. This is the seventh consecutive week with a bear bar.
The market is at a Nasdaq 50 percent retracement from the low of the pandemic to the all-time high. Buyers on higher time frame charts (yearly chart) may come in around here.
NASDAQ 100 Emini futures
The Weekly NASDAQ chart

- This week’s Nasdaq Emini candlestick is an outside bear bar with a close above last week’s low. The only positive for the bulls is that they were able to close above last week’s low with a tail at the bottom.
- If next week is a bull bar, it would setup a double bottom for a possible minor reversal.
- Bull upside targets that are interesting for the rest of this month –
- midpoint of monthly bar around 12523 – bulls would like the close above the midpoint. 50-60% likely
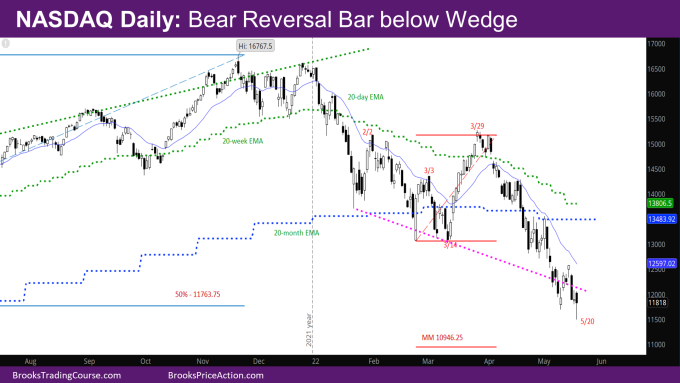
- the daily exponential moving average (EMA) at 12597 – 60% likely. Sellers will likely sell the daily EMA again.
- the open of the month at 12841 – 20% likely. There is not enough time given the market will likely sell off at the daily EMA again.
- the monthly EMA at 13535 – 10% likely
- The next target for the bears would be the measured move (MM) down of the double bottom (DB) on monthly chart at 10946.25, or the open of the November 2020 month at 11139.5. November 2020 is when the spike on the monthly chart started after the sideways months of September and October. At this point, it is likely these targets will be met.
- Best case, the month will end up as a doji below the EMA. There will be a big tail on top, which means next couple of months will be sideways to down.
The Daily NASDAQ chart

- Friday’s NASDAQ candlestick is a bear reversal bar with a close above the midpoint. This is not a good signal bar, so while the market may go higher, it will be a minor reversal.
- The week reached last week’s high on Tuesday and then sold off again for the rest of the week.
- As mentioned before, the daily EMA will now act as resistance. One of the first goals for the bulls is to have consecutive closes above the daily EMA.
- The bears will likely wait to sell at the daily EMA.
- What will be ideal for bulls is if the daily EMA and monthly EMA come close enough that the market crosses back above both like it did back on March 16th. This will likely not happen before next month.
Market analysis reports archive
You can access all weekend reports on the Market Analysis page.

