Market Overview: NASDAQ 100 Emini Futures
The NASDAQ Emini futures is at the high of the last two weeks. So, the question is – does the market go higher or reverse?
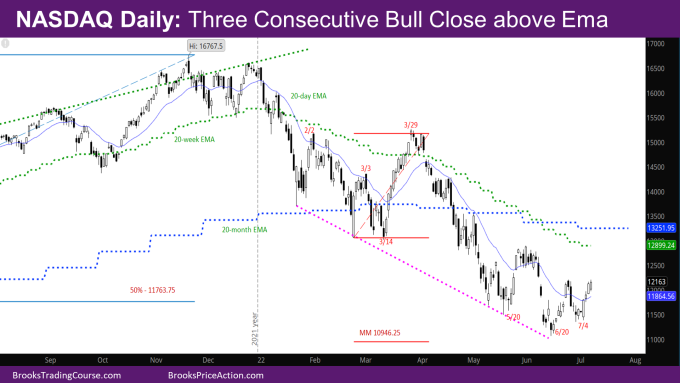
Every day of this short week was a bull bar. The market is also back above the daily exponential moving average (EMA), and 3 consecutive bull closes above EMA on daily chart for the first time since March. Even though the daily chart is in a second leg up since the June low, the second leg up this week is strong enough that there will likely be a third leg up. This should lead to at least slightly higher prices in the next couple weeks.
NASDAQ 100 Emini futures
The Weekly NASDAQ chart

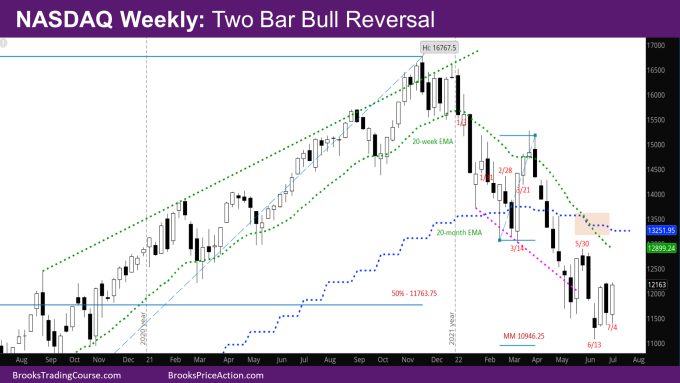
- This week’s Nasdaq Emini candlestick is a bull trend bar. It is a two-bar bull reversal, reversing last week’s bear bar.
- The market has tried making two pushes down – week of 6/13 and week of 6/27 and both reversed up. So unless there is a bear reversal bar again next week, the market may try in the other direction.
- Another positive for the bulls is that the bear bar last week is the first time since March that there hasn’t been a follow-though bear bar. If the bulls get a follow-through bull bar next week, it would be the first time since March that there are two consecutive bull bars.
- At the same time, the reversal that started the week of 6/13 is still likely a minor bull reversal since the 2nd bear leg that ended in May is so steep. The bulls will need a second entry buy after forming a good bull signal bar in the coming weeks.
- As mentioned in last week’s report, July will likely be a bull or doji month. So, the bull bar this week is a good start to the month for the bulls.
- The next target for bulls is the top of the most recent sell climax – 12899.25 and the weekly EMA in the same area.
- The bears would still like to make their target at the measured move (MM) down of the double bottom (DB) on monthly chart at 10946.25. This is still a viable target.
The Daily NASDAQ chart

- Friday’s NQ candlestick is a bull trend bar with small tails at the top and bottom.
- The market is back up above the daily EMA – with three consecutive bull closes above it (good for the bulls).
- Friday’s bar came close to last week’s high but did not close above it. If it had, it would have been a stronger case for the bulls.
- Still, the bull leg this week has been strong enough, that the market should get above last week’s high before it gets below last week’s low.
Market analysis reports archive
You can access all weekend reports on the Market Analysis page.

