Market Overview: NASDAQ 100 Emini Futures
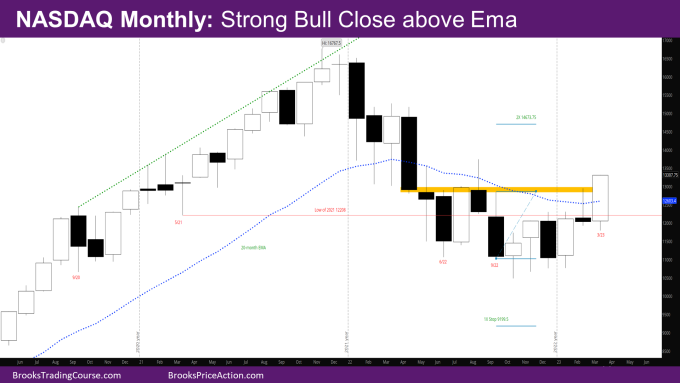
The NASDAQ Emini futures March candlestick is a strong bull close trend bar closing at its high above the February month high. It is also the first bull close above the monthly exponential moving average (EMA) since March 2022.
Since February was a weak sell signal bar in a bull micro channel, it was expected that that market would go above its high. The question was – Would it close above the February high and how good a close would it have?
The bulls have showed strength by closing on its high above the February high as well as well above the monthly EMA.
NASDAQ 100 Emini futures
The Monthly NASDAQ chart

- Last month’s report had mentioned that there is likely to be a 2nd leg up to the bull micro channel from October 2022.
- March has started the 2nd leg up and is a strong start to the second leg.
- March went below the February low and then reversed up strongly to also close far enough above the monthly EMA.
- The market is now near the top of the trading range from June 2022.
- The bulls need a strong follow-through bar to try and convert the market to be Always in Long (AIL).
- Last month’s report also mentioned that if March ends up as a bull bar around the February high, it could be doing the opposite of what happened in May-September.
- This could mean bears will try to sell in April to prevent having a follow-through bar for the bulls, and then bulls could create another buy-signal bar at the monthly EMA.
- The next target for the bulls is the high of the August 2022 sell-signal bar, followed by the high of the April 2022 sell climax bar.
- Since the market has been in a trading range on the monthly chart, it usually goes above one resistance, but not above the next one.
- So, it’s likely the market will go above the August high, but not the April high, before a leg down in the trading range.
- April 2022 was the strongest bear bar in the move down below the monthly EMA, so likely sellers will come in around the upper half of the bar.
- The bull targets mentioned in last month’s report and shown on the chart are still valid.
- The market is back in the area where there has been very little body overlap since the big bear bar in April 2022 – in other words, the bars after April have little body overlapping with the body of April. That has been a sign of strength on the part of bears.
- March has already created a body overlap with the April 2022 bar.
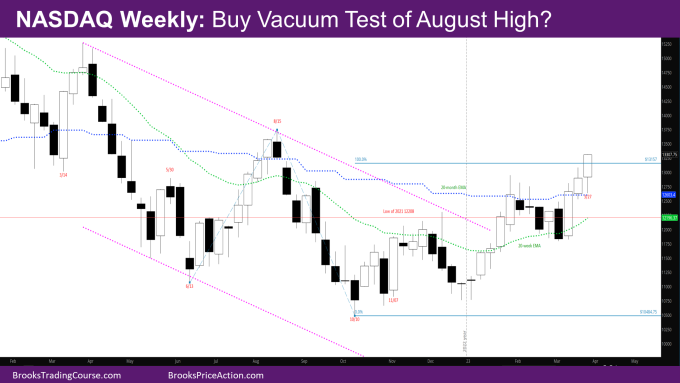
The Weekly NASDAQ chart

- This week’s candlestick is a bull trend bar closing on its high and a big tail below.
- This week while bigger than last week is still not climactic. Its body is proportional to last week’s body.
- This means there is likely more up before down.
- The week has also closed above last week’s high as well as the high of 1/30.
- The tail below this week shows that the bears tried to reverse the market, but buyers came in at the monthly EMA. Does that mean the monthly EMA is also acting like support?
- Since this week was also the last week of the month, it was going to decide how the month looked.
- The market has also met one of the bull targets mentioned in previous reports:
- Leg1/Leg2 target at 13157 where Leg 1 is the move up from June to August
- and Leg 2 is the move up from October.
- The next bull target is the close of Week of 8/8 at 13569.75 – the last bull bar of the micro channel up in August. That was a reasonable buy the close bar, and there are trapped bulls up there.
- The market is close enough to this target that it should reach it. The market may make a quick vacuum move to this target.
- The 2nd leg up since March is also a 3 bar bull micro channel (low of each bar higher than prior bar low) which means there will likely be another leg up after a pullback even if for one bar.
- As strong as the move up since October, since the reversal did not start with a bull signal bar, this is still likely a minor reversal, and the market may have to test back down again even if after 6-10 months.
Market analysis reports archive
You can access all weekend reports on the Market Analysis page.

