Market Overview: NASDAQ 100 Emini Futures
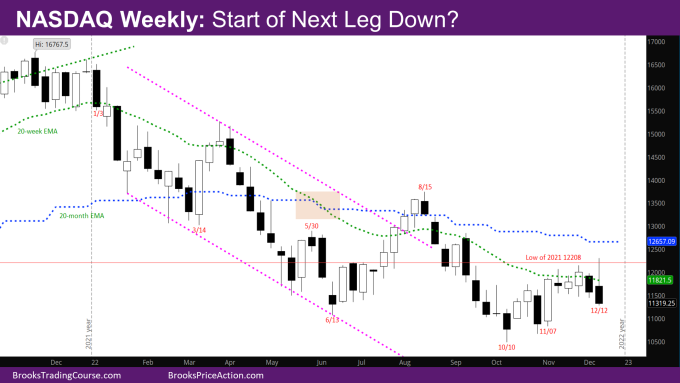
The NASDAQ Emini futures market went above the trading range of the past few weeks and reversed strongly to close as an outside down week. A possible start of next leg down.
For the past 4 weeks, bulls have been making money buying below bars, and bears selling above bars. The bear bars in the last two weeks are stronger than the bull bars two weeks before. The market continues to be in an expanding triangle – buying new lows and selling new highs.
While the outside bar this week looks bearish, it went much higher above the prior bar than below it, so buyers below. It’s likely the next couple of weeks maybe down to the open or low of the big bull bar of the week of 11/7, but also buyers around there.
What about the year end target of close above low of last year – 12208?
The market did go above this target this week but sold off sharply. Given there are only two more weeks left, unless both weeks are bull weeks, it is unlikely that the market will close above the target.
NASDAQ 100 Emini futures
The Weekly NASDAQ chart

- This week’s Nasdaq 100 candlestick is a big outside down bear bar at the weekly EMA with a big tail at the top.
- The bulls have only managed one bull close above the EMA in this move up since the October low.
- As mentioned above, given the two good bear bars, there will likely be some more selling to around the open/low of the week of 11/7.
- If that happens in the next two weeks, the year will close as a big bear bar.
- There will likely be buyers around the low of 11/7, but also another leg down after that.
- The market has made three pushes up from October low – the outside down bar this week likely being the third push up.
- There was always a leg down expected corresponding to the leg down in September. Could this be the start of that leg?
- As mentioned before, bulls will need a good signal bar around the bar from the week of 10/10. If the market makes that move down now, it may allow the bulls to create a good bull buy signal bar in the next month or two.
The Daily NASDAQ chart

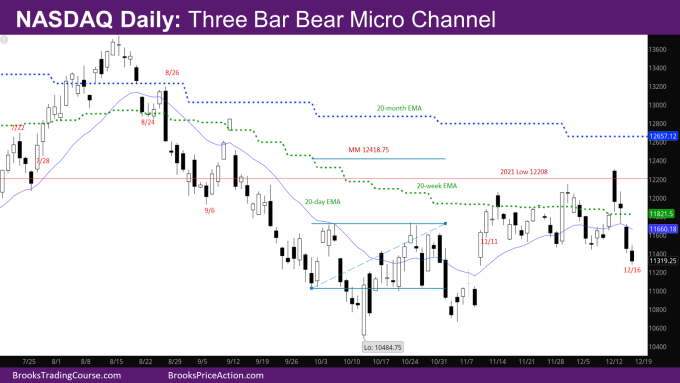
- Friday’s NQ candlestick is a bear trend bar below the bottom of the trading range that has been going on for the past 3 weeks.
- This week was mostly bearish – Tuesday, Thursday and Friday were strong bear trend days.
- As mentioned before, in the trading range of past weeks, the bears are stronger in that they have been creating 3-bar bear micro channel (bars where the high does not go above the prior high).
- This week the market created a 3-bar bear micro channel again.
- At the same time, bulls have not been able to create three consecutive bull trend bars with good closes.
- The move down this week is big enough that it should result in a second leg of its own.
- As part of this move down, the market will try to close the gap open between 11/9 and 11/10.
Market analysis reports archive
You can access all weekend reports on the Market Analysis page.

