Market Overview: NASDAQ 100 Emini Futures
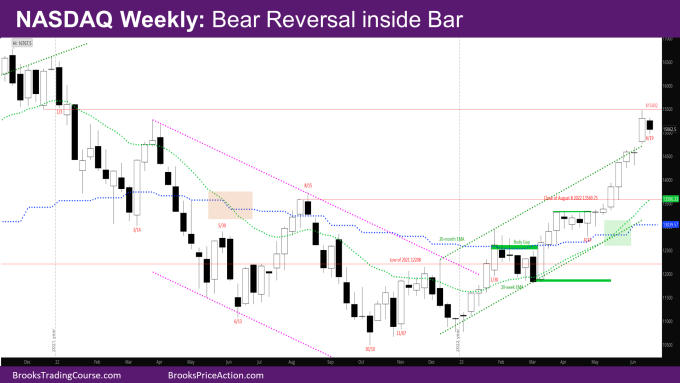
The NASDAQ Emini futures week is a bear reversal inside bar with small tails above and below. The market has been in a bull microchannel for the past 7 weeks – i.e., the low of each week has been higher than the low of the prior week. Next week will likely trigger the reversal bar, hence the low of next week will likely be below the low of this week.
Last week’s report mentioned how the June month bar so far is a strong bull trend bar as big as May. There was a possibility of the bar becoming too big if the market keeps going up. The bear bar this week has added a tail to the top of the June month bar. Bulls want to close next week as a bull bar, so the June month bar is closing near its high, while bears want the opposite and a bigger tail at the top of the monthly bar.
NASDAQ 100 Emini futures
The Weekly NASDAQ chart

- This week is a small bear reversal bar that is inside last week’s high and low.
- Since last week was a big bull bar, it was likely that this week would be a smaller trading range bar than another bull bar.
- If next week triggers the sell signal bar, there will likely be buyers below last week’s low.
- The market is breaking out above the channel shown on the chart.
- Usually, such breakouts return to the channel within the next 5-6 bars.
- As mentioned before, bears have not done much yet.
- There have been no consecutive bear bars since December of 2022.
- There has not been a close below a prior bar since early March.
- At the same time, bulls are creating breakout gaps by going above the August 2022 high.
- Bulls have also created body gaps with August 2022 high close and now March 2022 close.
- The first bear target is to close the March 2022 body gap.
The Daily NASDAQ chart

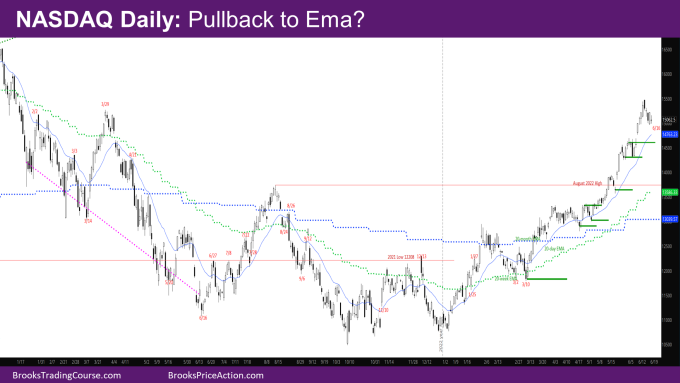
- Friday is doji inside bar with a small bull body and tails above and below.
- Monday was a trading holiday. Tuesday was a doji bear bar that went far below the bear reversal bar of last Friday.
- Wednesday was a bear breakout of Tuesday, and bears needed follow-through on Thursday.
- Thursday gapped below Wednesday but reversed and ended up as a bull outside up (OU) bar.
- However, given the strong bear bar Wednesday, there were likely sellers above it. They sold when Thursday went above Wednesday.
- Friday gapped down and ended up as a trading range day.
- The move down this week looks like a bear leg in a trading range.
- The market is close enough to the daily exponential moving average (EMA) that it will likely get there, even if it makes a leg up next week.
- The daily EMA is also in the same area as the last breakout point of early June, so a likely test target.
Market analysis reports archive
You can access all weekend reports on the Market Analysis page.

