Posted 6:49 a.m.
The Emini had a big gap up and then a couple of bull trend bars. This reduces the chances of a bear trend day. The bears need a strong bear breakout with follow-through, and this is unlikely at the moment.
The Emini will probably be mostly sideways to up for the 1st 1 – 2 hours. It is so far above the average price that bulls are hesitant to buy. The bull bars make bears hesitant to sell.
If it rallies for 2 hours, it will then probably go sideways for 2 or more hours. It would decide between trend resumption up and reversal down at the end of the day.
There is a 30% chance that the Emini has formed the low of the day. If it begins to channel up in a tight channel, and the channel has gaps, today could be a Small Pullback Bull Trend day.
If it reverses down, traders will look to buy a double bottom or wedge bottom near the moving average. The bears need a strong breakout and follow-through to make traders look for swing shorts. Because the daily chart is in a trading range, there is an increased chance of disappointed bulls and a bear trend, but it is still only about 30%.
Trading Brexit price action
S&P 500 Emini: Pre-Open Market Analysis
We will be trading Brexit price action this week. The Emini created a strong bull reversal bar on Thursday. It was also a higher low and a micro double bottom. Although the buy did not trigger Friday, because of today’s likely gap, it will probably trigger on the open. The 60 minute chart is oversold and should bounce.
The Emini had a wedge top on the daily chart on June 8. Maybe Friday’s micro double bottom lower low is the 2nd leg down. While that is possible, the channel down was tight. A tight channel after a wedge top is usually the 1st of two legs down. As a result, the Emini might rally for 2 – 3 days into the Brexit vote and then decide. The bulls want a new all-time high. Especially relevant is that the cash index came to within 14 points of its all=time high on June 8. That might be so close that it is not able to escape the magnetic pull. The cash index high was 2134.72 at 2134.72. If the case index rallies 63 points from Friday’s close to reach a new high above high, the Emini will rally about the same. That creates an Emini target around 2140, which is above its June 8, 2016 all-time high. With today’s big gap up, it is equally likely that there will be a lower high and a clear 2nd leg down.
Overnight Globex price action
It does not matter whether Friday was the end of the 1st or 2nd leg down. The odds are that it will rally for the next 1 – 3 days. There will be a big gap up today. When that happens, the Emini usually will be limited to 5 – 10 bars up. It would then be so far above the average price that most bulls would wait for a pullback to buy. As a result, the Emini usually then enters a trading range for an hour or two. Once it gets closer to the moving average, it decides between a 2nd leg up on the day and a reversal down.
If instead of rallying, it sells of, it might form a trend from the open bear trend. However, the odds still favor limited down for 5 – 10 bars and then a trading range. When there is a very big gap up or down, there is a 70% chance that the Emini will enter a 1 – 2 hours trading range before the end of the 1st hour.
As a result of the Emini being oversold on the 5 minute chart, the down side will probably be limited today. The best the bear probably will get is another day in the 5 day trading range.
If the bulls do get a new all-time high, it would be a 3rd push up from the May lows. The bulls want a strong breakout above the high and then a measured move up. The bears want either a major trend reversal from a lower or higher high. Both the bulls and bears are waiting for more information and the Emini is in breakout mode.
Forex: Best trading strategies
The EURUSD daily Forex chart rallied from a failed breakout below the June 3 bull breakout. It is forming a double bottom with that low. The 240 minute chart is rallying from a wedge bull flag that ended on Thursday. The bulls want to get above the June 9 1.1415 lower high. Head and Shoulders Top bears have their stops there. Most of all, they need to get above the May 3 high of 1.1616. If they succeed, they will then try to break above the top of the 2 year trading range. They hope to reverse the 2014 bear trend.
The daily chart has been in a trading range for 18 months. All markets have inertia. Consequently, they resist change. This means that the odds of a bull breakout are less than those of a failed breakout. The trading range will probably continue. A trading range always ends with a breakout. However, 80% of the breakout attempts fail. Consequently, this rally attempt will probably be just another leg in the trading range.
EURUSD Forex overnight price action
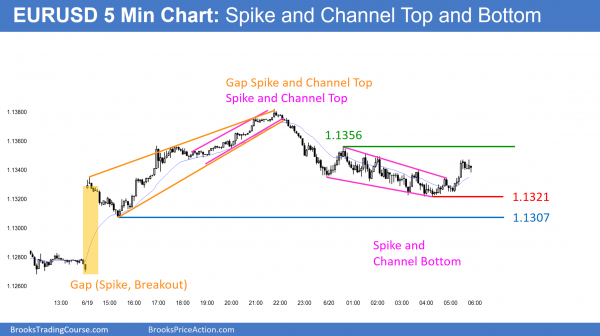
The EURUSD 5 minute Forex chart gapped up and formed a Gap Spike and Channel top. It then reversed down in a Spike and Channel bottom.
The overnight rally has not been especially strong. It reversed down in Europe, but the EURUSD is still up 70 pips. A Big Up, Big Down candlestick pattern indicates confusion. When traders are confused, they are confident that any move will be limited. The result is that they buy low, sell high, and scalp.
The selloff in Europe created a Spike and Bear Channel candlestick pattern. This is usually followed by a rally to the top of the channel, which is 1.1356, and then a trading range. The 1.1321 bottom of the channel is a possible bottom of the range.
The gap up overnight created a bigger Spike and Channel top. The 1.1307 low of the 1st pullback after the gap up is a target. The rally of the past hour might be a pullback from a 1st leg down. Bears will sell the rally, looking for a 2nd leg down. They hope that the bottom of the likely trading range will be at the lower support.
Forex day trading and the Brexit vote
The Brexit vote on Thursday will probably create a big move up or down. This is true whether the UK votes to stay in the EU or leave. Traders need to be open to all possibilities and ignore the experts on TV. The world markets have already factored in all information. The odds of a bull breakout are the same as for a bear breakout. The TV pundits are no better than a 50-50 bet. Wait for the reaction and see how strong it is. If it is strong, trade in that direction. If not, look for a reversal.
The UK vote comes this week and the daily chart in the middle of a trading range. Hence, there is uncertainty, which increases the chance of a trading range. Traders will take quick profits unless there is a strong breakout.
Summary of today’s S&P Emini futures price action and what to expect tomorrow
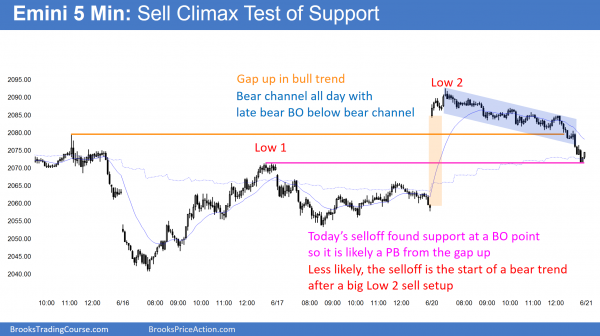
The Emini had a big gap up. It traded down in a bear channel, and it had a late bear breakout below the channel. The selling stopped at Thursday’s high and the 60 minute moving average.
The Emini gapped up, but then traded down in a bear channel all day. Today was a buy entry bar on the daily chart, but it closed on its low. It was a sell vacuum test of support at a prior high and at the 60 minute moving average. As a result of the bear bar today, the odds still favor a 2nd leg down from the June 8 wedge top. However, the daily chart is in a trading range. Consequently, the odds of everything are close to 50%. The choices are a new all-time high and a test of the May low. There will probably be a big move up or down after the UK Brexit vote on Thursday. The confusion of the past few days will probably result in tomorrow being another trading range day.
Today was a bear channel. Therefore, it is a bull flag. There is a 75% chance of at least a couple of hours of sideways to up trading tomorrow starting by the end of the 2nd hour. While there might be a gap down and a one day island top, the odds of a big move down are 25% after a sell climax. There is a 50% chance of some follow-through selling in the 1st 2 hours after today’s sell climax. The odds are that today was a bull flag.
See the weekly update for a discussion of the price action on the weekly candlestick chart and for what to expect going into next week.
Traders can see the end of the day bar-by-bar price action report by signing up for free at BrooksPriceAction.com. I talk about the detailed S&P Emini futures price action real-time throughout the day in the BrooksPriceAction.com trading room, and a 2 day free trial is available.
When I mention time, it is USA Pacific Standard Time (the Emini day session opens at 6:30 am PST, and closes at 1:15 pm PST). You can read background information on the intraday market reports on the Intraday Market Update page.


