May correction will give back all 2017 stock market gains
Updated 6:46 a.m.
The Emini gapped up big, but formed a couple bear dojis. This is consistent with what I said about a trading range for 2 – 5 days. The odds are that the Emini will gap down within a week and selloff 5%. This gap up is probably a bull trap. Yet, it might rally a little more before the bear trend resumes on the daily chart. This is a good price level to buy June or July put spreads, expecting a 100 point or more correction before expiration.
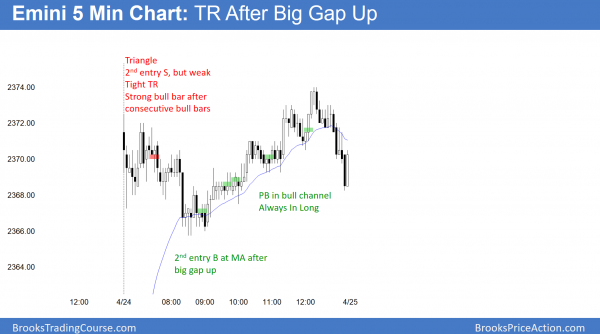
When there is a huge gap up, the upside is usually small for the 1st hour. The Emini usually has to get closer to the moving average. Given that this rally is almost certainly a trap, today could form an endless pullback bear trend. Traders need to be ready for this.
This is a trading range open on an overbought 5 minute chart. The odds are against a big bull trend day. Most likely, today will be a trading range day. Consequently, it will probably have both a swing up and down. If it rallies, that would create an even better price for buying put spreads.
Pre-Open market analysis
After Thursday’s strong rally, Friday reversed down. Yet, it held above Thursday’s higher low. Hence, the odds still slightly favor a test of the the April 7 lower high. Furthermore, the rally might test the March 15 high. Yet, because of the weekly chart’s unusual sell climax, the odds are that the Emini will fall more than 100 points before it rallies 50 points. This is an unusually strong trader’s equation for the bears. You can read more about this if my blog from Saturday.
The bulls hope that Friday’s selloff is simply a higher low major trend reversal. They therefore need a rally today or tomorrow. If instead the Emini continues down, the odds begin to favor a break below the March 27 low without one more test up.
Overnight Emini Globex trading
The Emini is up 24 points in the Globex market. It will therefore have a big gap up to test the April 5 bear reversal high. While the gap up is bullish, the most powerful influence in the Emini is the weekly chart. It has now been above its moving average for 24 weeks. The longest is has been above its average during the 8 year bull trend was 27 weeks. The odds are that the Emini will get down to that average within a few weeks. Since the average is around 2300, the Emini will probably selloff at least 70 points in May.
Furthermore, this strong rally will probably fail to make a new all-time high. Yet, because the breakout is so big, the odds are that the bears will need at least a micro double top. Hence, traders will probably buy the 1st reversal down. Consequently, the best the bears will probably get is a trading range for a few days. Big gaps up often lead to 2 – 5 day trading ranges, and that is likely now.
Can today be a big trend day? That’s always possible, but either a small day up or down, or a trading range is more likely. This is because the upside is limited by the weekly chart. In addition, the downside is limited by the strong momentum up.
EURUSD Forex market trading strategies
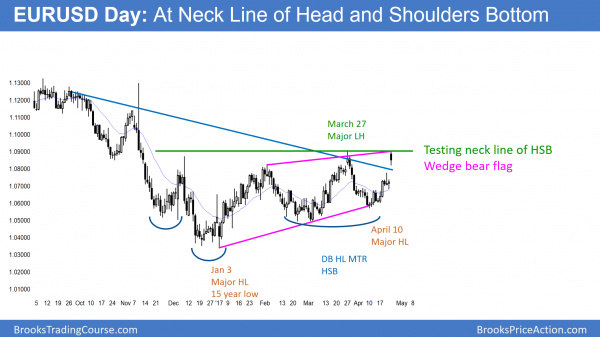
The daily EURUSD chart is in a trading range. The bears see a wedge bear flag after the strong selloff in November. Yet, the bulls see a reversal up from a double bottom higher low major trend reversal (a head and shoulders bottom).
Because the EURUSD daily Forex chart is in a 6 month trading range, it has reasonable buy and sell setups. The bears see the 2017 rally as a wedge bear flag after the strong selloff in November. Yet, the bulls see the April rally as an attempt to break above the neck line of a 6 month trading range. Hence, they believe that this is a double bottom higher low major trend reversal and a head and shoulders bottom.
I repeatedly wrote during the strong selloff in early April that it was likely to fail to break out. This is because 80% of trading range breakouts fail. Hence, the current strong rally is unlikely to successfully lead to a successful breakout. Yet, all trading ranges eventually break out up or down. Consequently, one of these strong rallies or selloffs will eventually lead to a successful breakout and a new trend. This trading range has lasted about 100 bars on the daily chart. Since that is a long time, it is unsustainable. Trading ranges always break into trends. Therefore the odds are going up that the breakout will come soon.
The daily chart is now testing the top of the range. Because the overnight gap up broke far above a 2 week wedge bear flag, bulls are trapped out of longs and bears are trapped into shorts. Consequently, both will buy the 1st reversal down. Therefore the bears will need at least a 2nd leg down before they can create a swing down. This is similar to the selloff that ended 2 weeks ago. There was a 2 day 2nd leg down.
Targets for the bulls
The bulls hope that the overnight gap will lead to a measured move up. Hence, their minimum target is above 1.1000. Since that is about 50 pips above the March 27 top of the 6 month trading range, traders would conclude that the breakout was successful.
They therefore would look for a measured move up based on the height of the 60 month trading range. That target would be 1.1475. Since that is above the November 9 bear reversal, traders would then believe that the rally could continue up to break above the 2 year range.
At the moment, the odds that the bulls will eventually successfully get their breakout are less than 50%. This is because the 2 year trading range is within a 10 year bear trend. Hence, the odds are the the 10 year trend will continue and that bull breakouts will fail. Yet, for traders, there is plenty of room for profitable long trades if the 2 week rally continues above the 6 month range.
Overnight EURUSD Forex trading
The daily and weekly charts had a big gap up overnight. Yet, the gap up created a 3rd push up from the April 10 low on the 240 minute chart. This 3 week rally is therefore another wedge rally. Since the gap was so big, this 3rd leg up will probably need at least a micro double top before the bears could get a 2 legged correction.
The EURUSD Forex market has been in a 30 pip trading range for 6 hours. The range is just below the March 27 top of the trading range, which is strong resistance. The odds favor at least a small 2nd leg up to test that high before the bears will be able to create a reversal down. Since this is important resistance, the EURUSD will probably either breakout and rally several hundred pips, or reverse back down in the range. Because reversals are more likely than breakouts, the odds are that the bulls will fail and the EURUSD will test back to the middle of the range.
Summary of today’s S&P Emini futures price action and what to expect tomorrow
After a big gap up and 2 hour pullback to the moving average, the market rallied in a weak bull channel.
I have been saying for weeks that the bears keep failing and therefore the Emini will probably test the March 15 lower high. The Emini is doing that right now. During the past 8 years of this bull trend, the weekly chart has never been above it 20 week EMA for more than 27 weeks. Furthermore, it has always begun to turn down by the 24th week. The current rally has been above the average for 24 weeks. Therefore, this week or next week will probably be the start of a move to below the weekly moving average. That average is a 2,300. While the Emini might reach 2400 1st, the math is great for the bears. This is because they are risking 30 points to make 70 points, and the probability might be 70%.
See the weekly update for a discussion of the price action on the weekly candlestick chart and for what to expect going into next week.
Traders can see the end of the day bar-by-bar price action report by signing up for free at BrooksPriceAction.com. I talk about the detailed S&P Emini futures price action real-time throughout the day in the BrooksPriceAction.com trading room. We offer a 2 day free trial.
When I mention time, it is USA Pacific Standard Time (the Emini day session opens at 6:30 am PST, and closes at 1:15 pm PST). You can read background information on the intraday market reports on the Intraday Market Update page.


