Tariff war but Emini wedge bottom at February low
Updated 6:45 a.m.
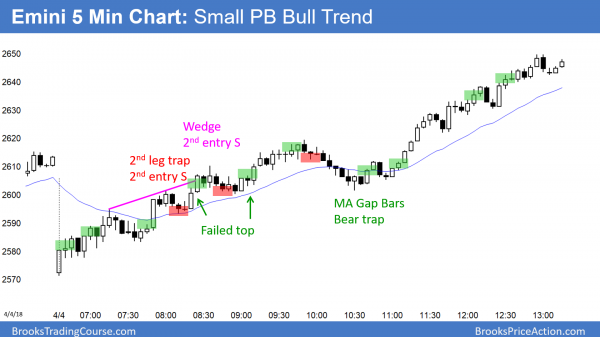
The Emini gapped up as expected. Since yesterday was a buy climax, the Emini will probably enter a trading range within a couple of hours. It might begin on the open.
The bulls want to keep the gap open. If it closes, it weakens the bull case. Therefore, the bulls will try to create a bull trend either on the open or after an early trading range.
The bears want the gap to close. In addition, they want a strong bear trend day. However, without consecutive big bear bars, that is unlikely.
At the moment, the 1st bar was a doji and the 2nd bar was an outside down bar. This increases the chances of a trading range open. Since yesterday’s bull channel was tight, any early selloff will be minor, even if it is deep. The bears will need a major trend reversal. That means that they will need a test back up before they can create a bear trend.
The bulls want an early reversal up from a test of yesterday’s high. But, that big bear bar makes a trading range more likely than an early bull trend.
Pre-Open market analysis
Yesterday, the Emini traded below Tuesday’s low and then above Tuesday’s high. It was therefore an outside up day, which is a sign of strength. Since the reversal is up from the support of the February low, the bulls hope that the monthly bull trend is resuming. However, they need at least a couple more strong bull days before traders believe the correction is over. If today gaps up, there would be a 9 day island bottom. That is another sign of strong bulls if the bulls can keep the gap open and create a bull trend day today.
If today gaps up, but the gap closes, then traders will think that the bull trend has not yet resumed. This is especially true if today is a bear trend day. The next couple of days will give traders important information about what the next few weeks will look like.
The bears will look to sell a 2 – 3 day rally. They want a break below the February low. But, the monthly bull trend is strong. Consequently, even if the bears break below the February low, the odds are that there will be buyers there. There is only a 30% chance of a strong break below that low.
Since yesterday was a buy climax, there is a 75% chance that today will have at least a couple hours of sideways to down trading that starts by the end of the 2nd hour.
Overnight Emini Globex trading
The Emini is up 14 points in the Globex market. It will probably gap up. If the bulls can keep the gap open and create a bull trend day, today will attract more buyers over the next week. That would make traders believe that the correction has ended.
Until the bulls get a strong series of 3 or more bull trend days, the bears will be willing to sell. If the bears can create a bear trend day today, there will be a 50% chance that they will get a break below the February low within a couple of weeks.
The answer is not yet in and therefore traders need to be ready for anything today. The most clarity comes from a big bull trend day today and again tomorrow. Without both, traders will assume that the 3 month trading range will continue.
Yesterday’s setups
Here are several reasonable stop entry setups from yesterday. I sometimes also show limit order entries and entries on the close of bars.
EURUSD not reversing up from double bottom
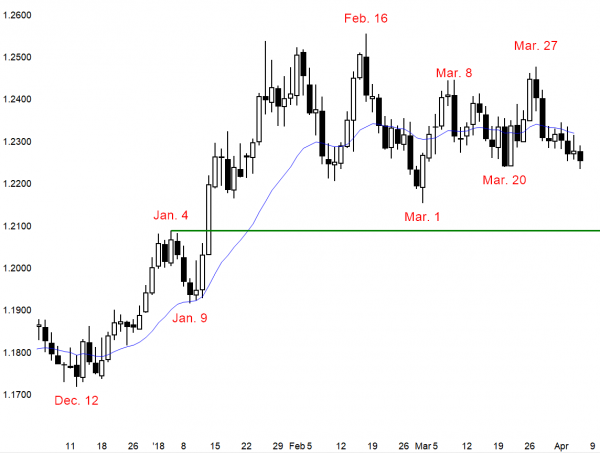
The EURUSD daily Forex chart is in an Endless Pullback from its 5 week rally. It broke below the March 20 low a few minutes ago, but stalled. If the breakout is strong, the selloff will continue down to the bottom of the 4 month trading range. The bulls want a lower low double bottom reversal up from the March 20 low.
The EURUSD daily Forex chart has sold off for 8 days after reversing down from a double to with the March 8 high. It has been in a tight bear channel for 6 days. There is no sign that it will reverse up. This is an Endless Pullback. Hence, it is the early stage of a swing down to the March 1 bottom of the trading range.
The bulls need a bull trend bar this week before traders will conclude that the chart will reverse up from around the March 20 low. At the moment, it is more likely that it will at least test a little below that support.
Triangle on the weekly chart
This week would then be the entry bar on the weekly chart for a break below a 4 month triangle. When there is a triangle breakout, in general, there is a 50% chance it will fail and reverse up. Since the weekly chart is in a strong bull trend, the odds are closer to 60% here.
However, there are magnets below. All support and resistance levels are magnets. The 20 week EMA is support and it is around the March 1 bottom of the 4 month trading range. It is also near the September 8 high of 1.2092. That is the breakout point for the January rally. The odds are that any selloff on the daily chart would reverse up from around these support areas.
Yet, a strong break below would result in a test of the November 7 low. That is the bottom of last year’s 4 month trading range.
Overnight EURUSD Forex trading
The EURUSD 5 minute Forex chart broke below the March 20 low a few minutes ago and is trying to reverse up. There is therefore an increased chance of a bull trend day today and tomorrow. If there is a strong reversal up, traders will swing trade for at least a 50% retracement of the 2 week 250 pip selloff.
There is also an increased chance of a bear trend day today. This is because traders might conclude that the break below the March 20 low will be successful. They would then hold for a swing trade down to the next support level, which is the March 1 low and the 20 week EMA. That is 100 pips below.
Since trading ranges resist breaking out, it is more likely that this bear breakout will fail. However, that does not mean an immediate reversal up. Instead, the 5 minute chart might have to go sideways for a couple of days before the bulls can create a bull breakout.
This is because trading ranges lack energy. Traders feel that the price is just about right. As a result, most moves take a while to start and stop. In addition, the strong breakouts lack follow-through. Consequently, they tend to last only a couple of days.
Summary of today’s S&P Emini futures price action and what to expect tomorrow
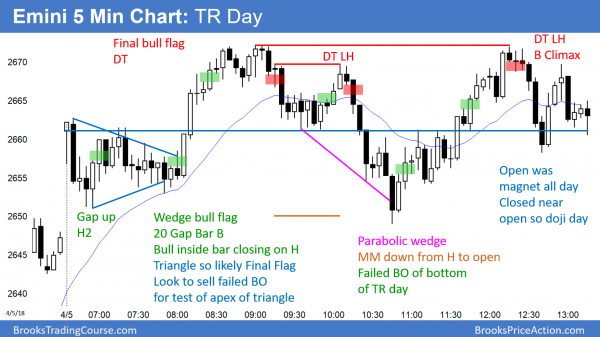
The Emini broke above a triangle, which became the Final Bull Flag. It reversed down and up again. Although it closed near its high, the day was a trading range day.
The bears closed the gap after a Final Bull Flag reversal, but the day closed as a bull doji bar. Since the bulls want a 2nd consecutive strong bull day, today was a weak follow-through day. Yet, if they get strong follow-through buying over the next few days, traders will conclude that the 3 month correction has ended.
See the weekly update for a discussion of the price action on the weekly candlestick chart and for what to expect going into next week.
Traders can see the end of the day bar-by-bar price action report by signing up for free at BrooksPriceAction.com. I talk about the detailed S&P Emini futures price action real-time throughout the day in the BrooksPriceAction.com trading room. We offer a 2 day free trial.
When I mention time, it is USA Pacific Standard Time (the Emini day session opens at 6:30 am PST, and closes at 1:15 pm PST). You can read background information on the intraday market reports on the Intraday Market Update page.


