S&P cash index new all time high: Updated 6:53 a.m.
The Emini gapped up on the daily and weekly charts to a new all-time high. The 1st bar was a big bull trend bar and it was followed by 2 bull dojis. While the odds are against a big bull trend day, this has been a bullish open. Also, there is a wedge channel top about 5 points above, which is a magnet.
Nothing has changed from what I wrote below. This is the follow-through buying that I discussed. There is still a 75% chance of at least 2 hours of sideways to down trading beginning by the end of the 2nd hour.
Because the follow-through has been dojis instead of big bull trend bars, there is still a 50% chance that the gap will close. If so, today would probably be a trading range day. As a result of the 1st 3 bull bars and the bull momentum, a bear trend day is less likely.
The odds are that today will have mostly trading range price action. If it is a trend day, it will probably be a weak trend, which means a broad channel or a trending trading range day. Because a trading range day is likely, today will probably have at least one swing up and one swing down. The market is currently deciding which will come first.
S&P cash index new all time high
S&P 500 Emini: Pre-Open Market Analysis
The Emini had a buy climax on Friday. As a result, there is a 50% chance of follow-through buying in the first 2 hours, but only a 25% chance of a strong bull trend day. Furthermore, there is a 75% chance of at least 2 hours of sideways to down trading that starts by the end of the 2nd hour. That trading range price action might have already begun in the final hour on Friday.
Most noteworthy was that the strong bulls were unable to rally 3 more points to a new all-time high in the cash index. This is a minor sign that the bulls might not be as strong as the rally makes them appear. Consequently, there is a slight increase in the chances for a double top. It does not matter if the cash index goes 5 – 10 points above its all-time high. If it turns down from this general area, traders will trade it like a double top on the daily chart.
Expanding Triangle Top on the daily chart
Furthermore, a reversal down here would trigger an expanding triangle top on the daily chart. Every Expanding triangle is a type of Higher High Major Trend Reversal. While beginners focus on «reversal,» experts know that a clear reversal setup only has a 40% chance of leading to a reversal. There is a 60% chance of the trading range or the bull trend continuing. Since a triangle is a horizontal channel, it is a trading range.
Importance of follow-through buying
If the bulls get a series of strong bull trend bars this week, the breakout would probably lead to a major swing up. It could last for months and 300 points, which is the height of the 2 year trading range. There is a 30% chance of this happening.
Whether or not there is a gap opening today, the most likely thing that traders will see this week is confusion. If there is a gap up, the gap would be on the weekly chart. That is unusual. It would be a sign of strength. Yet most breakout gaps are followed by at least 2 – 3 sideways bar. Traders decide whether the breakout will succeed or fail. If the bull trend resumes by the end of the week, traders will see that as good follow-through buying. As a consequence, bulls will be more willing to hold onto their positions and to buy more as the breakout continues.
Importance of a reversal down
In contrast, if the breakout quickly and strongly reverses, traders will conclude that the rally was just a test of the resistance at the top of the trading range. The bears need a strong reversal down. They have a 30% chance of succeeding.
Most likely, the Emini will be confusing over the next several days on the daily chart. This means that there probably will not be consecutive strong bull or bear trend bars. Instead, the bars will probably be unremarkable. The lack of urgency on the part of both the bulls and bears will probably result in a lot of trading range price action.
Globex session
The Emini is up 9 points, yet it has been in a tight trading range for 6 hours. If it opens here, it will have a small gap up. This would be a breakout and a gap up on the weekly chart. Although most breakouts fail, the context here makes the probability about 40% that it will stay open for at least a few days. Even if it closes, the odds still favor at least slightly higher prices this week because of the strong bullish momentum.
The top of the 60 minute wedge bull channel is around 2135, which is 6 points above the Globex high. It is a magnet and the Emini will probably reach the line this week. Since the line is rising, if the Emini does not get there quickly, it could be 5 – 10 points higher once the Emini reaches the target.
Forex: Best trading strategies
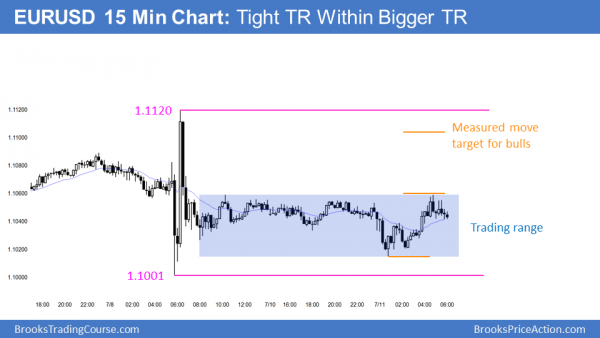
The 15 minute EURUSD Forex chart is within a 40 pip tight trading range. Day traders will scalp until there is a strong breakout up or down. Many scalpers will use limit orders and scale in.
The EURUSD daily chart has been in a tight trading range for the 3 weeks since its sell climax. There is no evidence that this will change. All trading ranges ultimately break out. The bears have the momentum of the strong breakout last month. However, as each new day gets added to the 3 week trading range, that breakout drifts further to the left. At some point, it loses all influence over the current price action.
The bulls have the advantage of the chart being at the bottom of a 6 month trading range. When a market is near the bottom of a trading range, there is an 80% chance that it will continue sideways or start to go up.
80% Rule
This is the result of my 80% rule. Markets have inertia. Consequently, they tend to continue to do what they’ve been doing. They resist change. Hence, there is an 80% chance that trading range breakout attempts fail. Furthermore, there is an 80% chance that trend reversals in a strong trend will fail.
The European Forex session
The EURUSD Forex chart has been in a 40 pip range overnight. Given that it has been in a very tight trading range for several weeks, this is what traders expected. It increases the chances of a tight trading range today. Yet, traders are always ready for a breakout, even when it is unlikely.
Summary of today’s S&P Emini futures price action and what to expect tomorrow
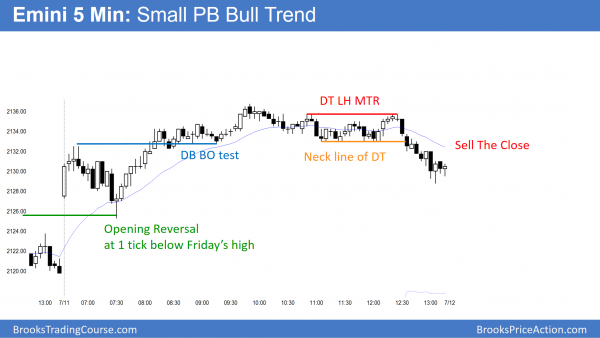
The Emini closed the gap above Friday’s high, but rallied from an opening reversal test of that gap. It spent most of the day in a tight trading range. While there was a late small trend reversal down, the Emini still closed at a new all-time high.
As I mentioned earlier, today looked like it was likely to have a lot of trading range price action. Most of the day was within a 3 point range. When there is a breakout gap on the daily, like today, the Emini usually goes sideways for 2 – 4 days in a narrow range. It then decides whether to resume up or reverse down. Tomorrow will probably also be another small, mostly sideways day.
Today is a sell signal bar on the daily chart, yet the 2 week rally is in a tight bull channel. Therefore, the bears will probably need at least a micro double top before they will have a chance at a reversal.
The cash index finally broke to a new all-time high, above the May 2015 high. However, the breakout was small. This reduces the chances that it will be successful. The bears want a double top with the prior high, and the bulls want a measured move up. The market will probably need several days to make up its mind.
See the weekly update for a discussion of the price action on the weekly candlestick chart and for what to expect going into next week.
Traders can see the end of the day bar-by-bar price action report by signing up for free at BrooksPriceAction.com. I talk about the detailed S&P Emini futures price action real-time throughout the day in the BrooksPriceAction.com trading room, and a 2 day free trial is available.
When I mention time, it is USA Pacific Standard Time (the Emini day session opens at 6:30 am PST, and closes at 1:15 pm PST). You can read background information on the intraday market reports on the Intraday Market Update page.


