September unemployment jobs report breakout
Updated 6:48 a.m.
The Emini has sold off for 8 days and yesterday reversed up from the bottom of the month-long trading range. It also rallied on the unemployment report before the open today. While it gapped up on the open, it formed doji bars just below the August 29 major lower high. This hesitation increases the chances of a pullback lasting 5 – 10 bars. The bulls would then try to reverse up from a double bottom or wedge bull flag, maybe just above the moving average.
Because the Emini has been in a trading range for a month, the odds also are that breakouts up and down will disappoint bulls and bears. After 8 days down, the odds are that the Emini will trade sideways to up for at least a couple of days.
While it is possible that today could be a bear trend day, it is more likely going to be either a bull trend day or a trading range day. It is possible that today could be a strong bull trend day and break to a new all-time high. However, the hesitation on the open make either a weak bull trend day or trading range day more likely.
Pre-Open Market Analysis
The Emini is still pulling back from its August 2 bull breakout. Yesterday’s reversal up was from a small breakout below the August 26 low, which was a small breakout of the August 17 low. The rally yesterday completed the Small Breakout of a Small Breakout Wedge bull flag pattern. If the Emini therefore breaks below today’s low within the next couple of days, there would be at least a 50% chance of a measured move down. Hence, that would be a failed wedge bull flag. A measured move down would therefore result in about a 100 point correction.
Furthermore, it would break below the top of the 2 year trading range. Most breakouts late in a trend fail at least enough to close the gap. Therefore, the odds are that the Emini will trade back down to 2100 or below before it gets much above 2220.
Unemployment report
The Emini has been sideways for 2 months. It is looking for a catalyst that will create a breakout and then a trend. Today’s report and the September 21 FOMC meeting are possible candidates.
While the daily chart is still in a bull trend, it has a Final Flag top and reversal down. The Emini is in breakout mode. Because most breakouts fail, the odds still slightly favor the bulls, but not by much. If the Emini breaks below yesterday’s low, it could quickly fall below 2100. If it breaks to the upside, the breakout will probably fail around the 2200 – 2220 measured move targets.
Emini Globex session
The Emini is rallying on the bad unemployment number. Yet, as long as it stays below the August 26 and 29 double top, it is still forming lower highs. It is therefore still in an early bear trend. All trends often have extremely strong pullbacks. If the Emini rallies for several days and has one or more strong bull trend days, but fails to get above those major lower highs, the Emini will remain in a broad bear channel. Yet a break above those highs would increase the odds of a new all-time high. Because the Emini is still holding above the moving average and there are targets above, the odds already slightly favor at least one more new all-time high.
Forex: Best trading strategies
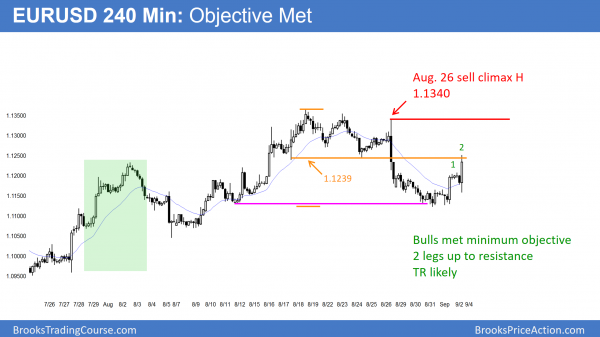
The EURUSD 240 minute Forex chart met its minimum objective. Today is the 2nd leg up from a sell climax down to support. It is now at resistance at the bottom of the trading range. Unless it breaks strongly above that level, it will probably go sideways for a day or two.
The EURUSD 60 minute Forex chart broke strongly to the upside yesterday. Yet, the follow-through was weak. The rally was strong enough to make a 2nd leg up likely. Yet, today’s unemployment report can create a strong trend up or down. As a result, the EURUSD could easily sell off and erase yesterday’s gains.
EURUSD Forex overnight sessions
The EURUSD Forex market rallied on the weak unemployment report this morning. Yet, there was bad follow-through on the 5 minute chart, and the rally stalled at the bottom of the late August trading range. A strong rally would not have stopped at resistance. Because of this, the odds are that it will go sideways today. The rally is strong enough so that bulls will probably buy the 1st reversal down. Yet, the bad follow-through means that the bears were strong enough to stop the bulls. With the bulls and bears about equally as strong, the chart will probably go sideways
If the bulls win, the next target is the August 26 sell climax high. Regardless of what happens, there is still no sign that the EURUSD is about to breakout out of its year long trading range. Therefore, traders will continue to exit positions in only 3 – 5 days.
Summary of today’s S&P Emini futures price action and what to expect tomorrow
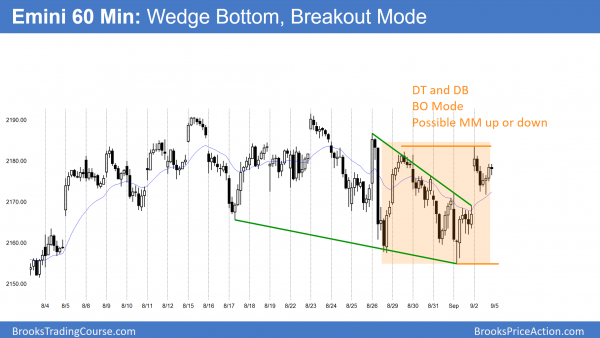
The 60 minute Emini chart has a double top and a double bottom. It is in breakout mode.
The Emini had a quiet trending trading range day today. After forming a lower trading range, it traded back into the upper range, as it does 60% of the time. Today was a weak buy entry bar on the daily chart, and an average buy signal bar on the weekly chart. The odds still slightly favor one more new high before the correction, but the bears have done enough and the correction might already have started. The bears need a big bear trend bar on the daily chart that closes on its low and below the low of the August tight trading range.
See the weekly update for a discussion of the price action on the weekly candlestick chart and for what to expect going into next week.
Traders can see the end of the day bar-by-bar price action report by signing up for free at BrooksPriceAction.com. I talk about the detailed S&P Emini futures price action real-time throughout the day in the BrooksPriceAction.com trading room. We offer a 2 day free trial.
When I mention time, it is USA Pacific Standard Time (the Emini day session opens at 6:30 am PST, and closes at 1:15 pm PST). You can read background information on the intraday market reports on the Intraday Market Update page.


