President Trump all time stock market high rally
Updated 6:47 a.m.
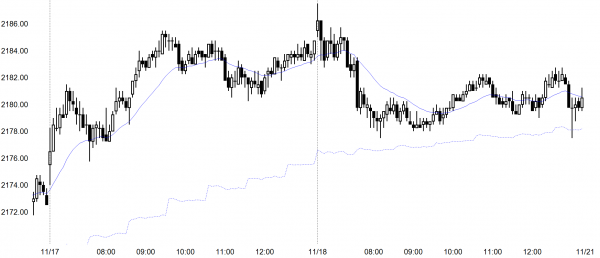
The Emini broke above yesterday’s high. It immediately reversed down from its new all-time high. Yet, the sell signal bar had a bull body. Furthermore, most of yesterday was trading range price action. In addition, the target for the bears is the open of the week. Because it is 20 points below (which is far) and this initial reversal down is week, the odds are that the bears will not get there today.
The bulls are failing at resistance. The bears will probably be unable to reach support. Yesterday was mostly trading range price action. The open was a limit order market. As a result of these factors, the odds favor a lot of trading range trading today. Furthermore, the early limit order trading within yesterday’s 4 hour range increases the chances of an hour or two of limit order trading. The odds favor a trading range day. But, be ready for a Buy The Close final hour. A Sell The Close end of the day is less likely.
Pre-Open Market Analysis
The Emini moved above the August all-time high by 0.5 yesterday. The daily chart is accelerating up. There is therefore no sign of a top. Yet, the rally is climactic. Hence, it could reverse at any time.
The bears want a higher high major trend reversal. Yet the 6 day rally since the Trump election has been in a tight bull channel. That is a breakout on the weekly chart.
Weekly Emini chart
Since this is the follow-through week after last week’s breakout on the weekly chart, its appearance is importance. Hence, if it closes on its high, the odds would be 60% that the Emini will go at least a little higher. If the close creates simply the absence of a bear body or even with a small bear body, the odds would be better than 50% that the Emini will go higher.
Yet, if it closes on its low, the odds would be about 50% that the Emini would reverse for at least a bar or two. Since the reversal down would be a failed breakout of a four month trading range, it could be the high for several months. At the moment, the odds favor higher prices.
Because today is Friday, bulls and bears will fight over how bullish the bar is at today’s close. The bulls want a close at a new all-time high. The bears want a close below the open of the week. Because that is 20 points below yesterday’s close and the daily ranges have been about 15 points, the odds are against the bear close. More likely, the 6 day bull channel will continue.
In addition, the all-time high is an inflection point. Like all resistance, it is a decision point and therefore the Emini could have a bog move up or down today. If there is a big move, up is more likely.
Overnight Emini Globex trading
The Emini extended its new high overnight. Yet, it pulled back again. The overnight trading was sideways. The Emini is stalling at the all-time high. Today is Friday and therefore more important. As a result, the Emini will probably not have a strong bull trend early in the day. Instead, it will more likely wait trade sideways early. Traders should be prepared for a possible rally in the final hour. Bulls will try to create a weekly close at a new all-time high. Less likely, it will sell off to below the week’s open.
EURUSD Forex Market Trading Strategies
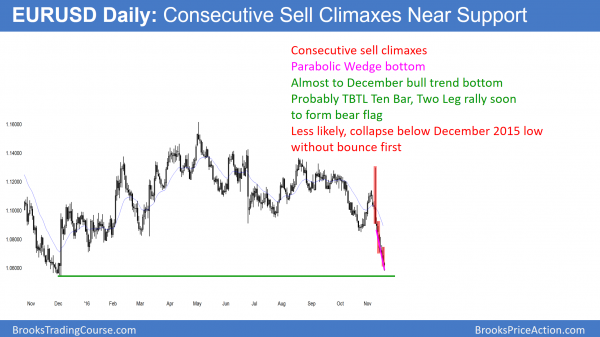
The daily chart has had 3 consecutive sell climaxes since the election. This is therefore a parabolic wedge just above support.
The EURUSD daily chart’s sell climax is continuing to grow. The next target is the December 2015 low of 1.0539. This is about 60 pips lower. While it is possible for the EURUSD to continue to collapse below that low, it is more likely that bears will use that area for profit taking. Their stop on the daily chart is now above last week’s high. That therefore means they are risking about 700 pips, which is a lot. Many firms will reduce their position size to reduce their risk.
Because the selloff is in an 8 bar bear micro channel, the odds are that traders will sell the 1st rally. Therefore any bottom over the next few days would probably be minor. This means that it would more likely create a bear flag and lead to at least a test of this week’s low.
As a result of the parabolic wedge bottom and consecutive sell climaxes, a 2 week sideways to up bounce is likely. It will probably be a bear flag. Therefore, it will probably lead to another test down of the December 2015 low.
Consecutive sell climaxes
Since the EURUSD has had a series of sell climax on the daily chart since the election, the odds are that it will reverse up sharply and then enter a trading range for a week or two. Yet, there is no bottom yet. Furthermore, there is a magnet at the December 2015 low. Some traders will continue to sell down here, hoping for one more trade before the bounce. These traders will scale in higher if the reversal up comes right after entry. They correctly believe that the odds are that even a strong rally will be temporary. They know that the odds are that they will make money if they trade small and scale in. Since the risk of a 200 pip or more rally coming within a couple of weeks is 50% or more, most bears should wait to sell the rally.
Overnight EURUSD Forex trading
While the EURUSD rallied 60 pips overnight, the rally has a wedge shape on the 5 and 60 minute charts. It is therefore a bear flag. Because the 60 minute channel has lasted more than 100 bars, there will probably be a bull breakout above the channel within a couple of days. As a result, the bear trend will then evolve into a trading range. Hence, the chart will probably begin to show increasing trading range price action for a week or two.
Because the momentum down is strong, the EURUSD could collapse through the December 2015 low. Yet, the parabolic wedge sell climax makes it more likely that bears will use this as an opportunity to take windfall profits and reduce risk. Therefore, the EURUSD is more likely to bounce for a couple of weeks here, or just from below the December 2015 low.
Summary of today’s S&P Emini futures price action and what to expect tomorrow
The Emini reversed down from above yesterday’s high, which was the all-time high. After a weak selloff, the bulls had a weak rally that failed. The selloff bounced at the 60 minute moving average. The day was a trading range day.
The daily chart has a small, 7 day wedge top. Therefore, traders are looking for a small pullback, maybe to bottom of the wedge channel. That is Last Thursday’s low, around 2150. The bulls want the channel to continue higher. Because the Emini stalled at the August high yesterday and again today, the odds favor at least a small pullback.
See the weekly update for a discussion of the price action on the weekly candlestick chart and for what to expect going into next week.
Traders can see the end of the day bar-by-bar price action report by signing up for free at BrooksPriceAction.com. I talk about the detailed S&P Emini futures price action real-time throughout the day in the BrooksPriceAction.com trading room. We offer a 2 day free trial.
When I mention time, it is USA Pacific Standard Time (the Emini day session opens at 6:30 am PST, and closes at 1:15 pm PST). You can read background information on the intraday market reports on the Intraday Market Update page.


