Monthly chart’s parabolic wedge buy climax will soon evolve into trading range
Updated 6:54 a.m.
The Emini opened at a new high, but began with 2 doji bars. While each of the past 5 days only dipped a little below their opens and then formed strong bull trend days, that is unusual. Therefore it is less likely to happen again today. Consequently, the odds are increasing for a day that falls far below the open. It would then either be a bear day or a doji day. There is no sign of that yet, but the chance is increasing.
At the moment, the Emini is Always In Long and there the top of the 4 day channel is 3 points above the open. It is therefore resistance. Since the odds of a day that falls at least 3 points below the open is increasing, bears will look for an early high of the day and a reversal below the open. The bulls want a 6th strong bull trend day.
The open looks like Monday where there was an absence of bear bars. Yet, the rally is weak and therefore it will likely be a bull leg in a trading range. Consequently, the Emini will probably create an early high. However, the bears need a strong reversal down if they are to get a bear trend. More likely, an early selloff would last 2 – 3 hours and lead to a swing up. which would form a trading range day.
Pre-Open market analysis
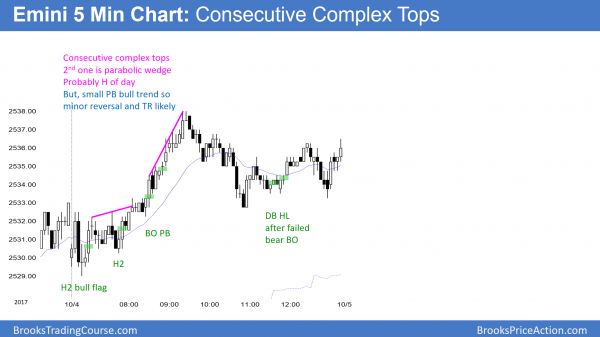
The Emini rallied strongly yesterday to another all-time high, but then reversed down from a parabolic wedge top. It spent the rest of the day in a trading range. There are buy climaxes on the 60 minute, daily, weekly, and monthly charts. Therefore, the Emini is susceptible to a pullback. The average bar on the monthly chart is about 80 bars.
If this month or next month formed a pullback, by definition, that would mean that it pulled back below the low of the prior month. Since an average bar is 80 points tall, this means that the pullback would be at least 80 points tall. More likely, it would 100 points. Since the buy climaxes are so extreme, it could be as much as 200 point.
Since the monthly chart is so extremely overbought, the odds are that a pullback will begin this month or next. However, until there is a top, there is no top. This means that the odds favor at least slightly higher prices.
Breakouts lead to tight trading ranges
The daily chart is in an 8 bar bull micro channel. Therefore, yesterday’s reversal will probably be minor. Bulls will buy below yesterday’s low. Yet, if the bears get 3 consecutive strong bear bars or a micro double top, traders will begin to wonder if the 100 point correction has begun.
Tight bull channels only rarely convert into bear trends. When they do, they usually end with a parabolic wedge top. There is no sign of one yer.
Every trend eventually ends. However, it usually evolves into a trading range rather than reversing. Therefore, traders expect that the current strong breakout will soon begin to enter a tight trading range. A tight trading range has many bars with prominent tails and small bull and bear bodies. Big bull and bear bars have bad follow-through, and they reverse within a day or two. There is no sign of this yet. Since a trend usually has to be in a range for 10 or more bars before reversing, the odds of more than a 1 – 3 day pullback are small for at least a couple of weeks.
Overnight Emini Globex trading
The Emini is up 2 points in the Globex market. While the daily chart’s rally is slowing down, it is very strong. Therefore the best the bears will probably get over the next few days is a 1 – 3 bar pullback. However, since the rally is climactic, the daily chart will probably soon enter a tight trading range for at least a couple of weeks.
As a result, instead of every day being a bull trend day, the Emini will probably begin to form trading range days and days that have prominent tails on the daily chart. Those tails mean that the 5 minute chart is having reversal. Traders will begin to look for swings up or down lasting 2 – 3 hours, and then a reversal and an opposite swing of 2 – 3 hours.
Yesterday’s setups
Here are several reasonable stop entry setups from yesterday. I sometimes also show limit order entries and entries on the close of bars.
EURUSD Forex market trading strategies
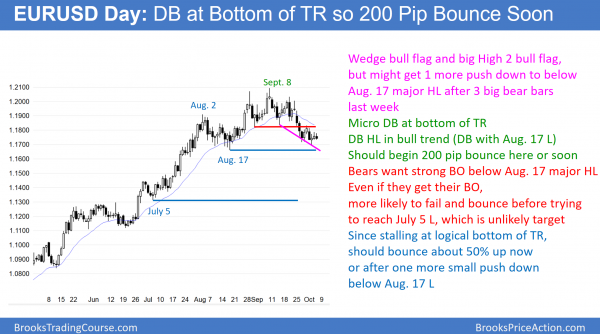
The EURUSD daily chart is in a 7 day tight trading range at the bottom of a 2 months range. Last week’s 3 consecutive bear bars was a strong enough breakout so that the bears might get a 3rd push down to below the August 17 major higher low. Yet, the odds are that trading range breakouts fail, Therefore, the bulls should get a test back to the middle of the range within a few weeks.
The bulls want a double bottom with the August 17 major higher low and then a resumption of the strong bull trend on the weekly chart. Since the trend up is strong and most trend reversals fail, the odds favor about a 200 pip rally from the current area soon. Since the 3 bear bars last week were strong, they might be a small spike in a spike and channel bear trend. Consequently, the bears might get a third push down.
Furthermore, trading ranges often have legs that go beyond support or resistance before reversing. Therefore the bears might get a breakout below the August 17 major higher low. Since bull trends need a series of major higher lows, a drop below that low would technically end the bull trend on the daily chart. The chart would then be either in a trading range or a bear trend. It would still be in a bull trend on the weekly chart.
Since most breakouts fail, the odds would favor a trading range on the daily chart. Therefore, the daily chart should rally from around where it now is, but fail to break to a new high. The trading range is likely to continue for at least a few more weeks. However, it is still a bull flag on the weekly chart.
Overnight EURUSD Forex trading
The bears have a Low 2 bear flag on the daily chart. They need a breakout below yesterday’s low to trigger the sell signal. Today’s low is 1 pip above yesterday’s low. However, even if they trigger the sell, it is in a 7 day tight trading range and at the bottom of a 2 month trading range. While the bears might get a strong bear trend day today, it is more likely that there will be buyers below yesterday’s low. Therefore the 7 day tight trading range will probably continue at least a few more days before there is a swing up.
The bears might get a 1 – 3 day breakout below the August 17 low, but the re is only a 40% chance of a successful strong breakout. Therefore there is a 60% chance of a swing up from the current level, whether or not the bears get a brief breakout below the August 17 low.
Because the daily chart is in a 7 day tight range, day traders will continue to mostly scalp. However, they might soon get a swing down. Furthermore, they will probably get a swing up within about a week.
Summary of today’s S&P Emini futures price action and what to expect tomorrow
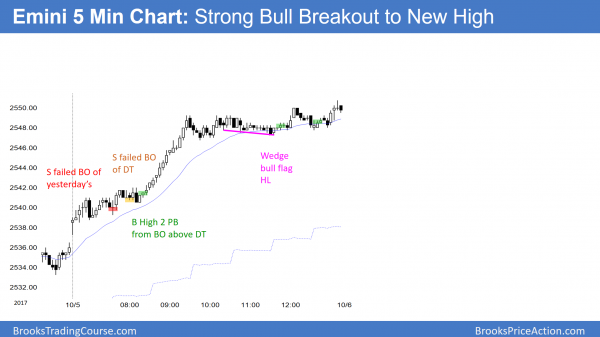
The Emini broke strongly above an attempt at a failed breakout above yesterday’s high. The rally did not pause until after 15 consecutive bull bars. After a 3 hour tight range, the bulls got minimal trend resumption up into the close.
Today was exceptionally strong, but it is late in the bull breakout on the daily chart. Therefore the odds favor a 1 – 2 day pullback beginning tomorrow or Monday.Because the breakout is so strong, bulls will buy the reversal. The odds favor higher prices over the next several days. However, there will probably be a 2 week trading range starting within a week after such an extreme buy climax.
See the weekly update for a discussion of the price action on the weekly candlestick chart and for what to expect going into next week.
Traders can see the end of the day bar-by-bar price action report by signing up for free at BrooksPriceAction.com. I talk about the detailed S&P Emini futures price action real-time throughout the day in the BrooksPriceAction.com trading room. We offer a 2 day free trial.
When I mention time, it is USA Pacific Standard Time (the Emini day session opens at 6:30 am PST, and closes at 1:15 pm PST). You can read background information on the intraday market reports on the Intraday Market Update page.


