Posted 6:54 a.m.
The Emini sold off on the open to below the 60 minute moving average down to a 50% pullback of yesterday’s rally. The channel down had about 15 bars and it was tight. This means that the 1st reversal up will probably be minor. A minor reversal is a leg in a trading range. The bulls would then usually need a test back down to form a double bottom before they will be able to get a strong trend up. The selloff was strong enough to make a strong bull trend day unlikely. While the bears want a trend from the open bear trend, the odds are that they will need a major trend reversal. This means that they will need a rally that fails and becomes a lower high.
Although the Emini is currently Always In Short, the odds are that there will be a trading range for the 1st hour or two. The selloff was too strong to make a bull trend likely, especially without 1st forming a double bottom. The bounce at a 50% pullback and the strength of yesterday’s rally make a bear trend unlikely without 1st forming a lower high.
Pre-Open Market Analysis
S&P 500 Emini: Online day traders see topping and bottoming candlestick patterns
The Emini had a small pullback bull trend yesterday. There is a 25% chance that today will be another strong bull trend day, and a 50% chance of follow-through buying in the 1st 2 hours. There is also a 75% chance of at least 2 hours of sideways to down trading that begins by the end of the 2nd hour. That process might have already begun in the final hour of yesterday.
The daily chart turned up yesterday from the bottom of a 2 month trading range. That trading range is also a Head and Shoulders top, but the rally to the right shoulder lasted only 3 bars. When it is less than 5 – 10 bars, the odds of a major reversal are small. The bears hope that today’s rally will form a double top for the right shoulder with last week’s rally. They then want a breakout below the 2033.75 neck line, and a measured move down. There is less than a 40% chance of this happening.
The 60 minute chart has a Head and Shoulders bottom. Yesterday’s rally was from the right shoulder. If there is a pullback today, the pattern could become nested. This means that the right shoulder becomes a smaller head and shoulders bottom. Nested patterns in general have a higher percentage chance of success.
Yesterday’s rally on the 60 minute chart lasted 8 bars, and 6 of the bars had bull bodies. This makes it likely that the 1st pullback will be bought, even if it is deep. Remember, a pullback today or tomorrow that begins to reverse back up creates a nested Head and Shoulders bottom, which is a more bullish pattern. However, until there is a breakout, there is no breakout. Even though the chart is more bullish than bearish, it is still in a 3 week tight trading range, and it is more likely to continue sideways than it is to successfully breakout.
At the moment, the odds favor a bull breakout above 2080, but the Emini would not be in a tight trading range if the advantage of the bulls was great. It is real, but the bulls might have only a 55% chance of a successful breakout.
The Emini has had an unusually big number of small pullback trends over the past 3 weeks. There are normally only a couple each month, but there have been at least 8 in the past month. This is getting extreme. Once all of the algorithms begin to trade the same way, there is no one to take the other side. The Emini then changes to some other pattern. At the opposite extreme is a tight trading range. I don’t know if we will start seeing small ranges, but the odds of the continued frequency of small pullback trends is small. The Emini will begin to do something else. Another possibility is days that start as small pullback trends, but then reverse. Be open to anything.
The Emini had a higher high major trend reversal in the Globex market, but the selloff so far has not been strong. It is now down about 4 points.
Forex: Best trading strategies
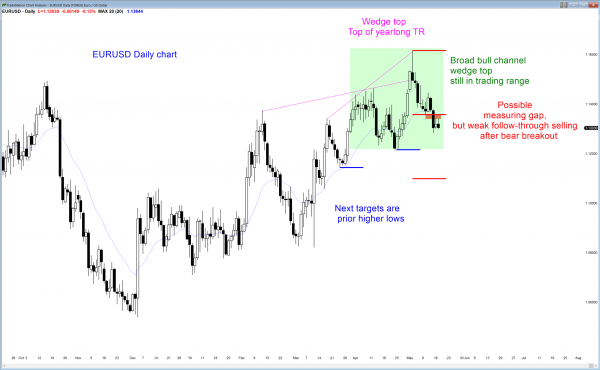
The daily EURUSD Forex chart has been sideways for 6 weeks. All trading ranges contain tops and bottoms. The bulls see a broad bull channel. The bears see a wedge top. [Note that yesterday’s chart was a 20 minute chart and not a 120 minute chart.]
The EURUSD daily chart has been sideways for a couple of months. It is still forming higher lows and is still in a broad bull channel. It had a wedge top 3 weeks ago and 2 small legs down. When the legs are in a tight channel like that, they are usually part of the 1st leg of a bigger 2 legged pullback. The daily chart is neutral and in breakout mode.
It had a bear breakout on Friday. Instead of today showing strong follow-through selling in the form of a big bear bar, which typically happens at the start of a bear trend, yesterday was a bull doji. This is weak follow-through selling, and it is consistent with the idea that the bear breakout only has about a 40 – 50% chance of becoming a measuring gap.
The selloff might test the April 25 bottom of the most recent bull leg at around 1.1214 (the most recent higher low in the broad bull channel). However, the lack of consecutive big bear bars in the selloff from the May 3 wedge top make a trading range more likely than a bear trend. The EURUSD will probably be mostly sideways for at least a week or two.
A broad bull channel needs higher lows. That April 25 higher low is therefore a magnet. The bears want to get below it so that traders will conclude that the bull trend (broad bull channel) on the daily chart as ended. Most trends are followed by trading ranges. The odds are that there are buyers below that low. However, if there is a strong bear breakout, the bears could take control.
The daily chart is in a 3 day tight trading range, and had trading range price action overnight. Online Forex day traders are still scalping, waiting for a strong breakout and follow-through.
Summary of today’s S&P Emini futures price action and what to expect tomorrow
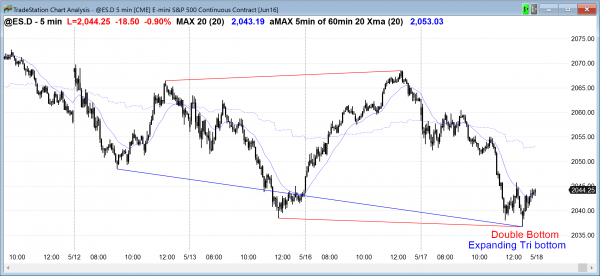
After a wedge bear flag, the Emini had a strong selloff midday.
The Emini had a wedge lower high major trend reversal that was followed by a strong bear breakout and measured move down midday. It is still in a 2 month tight trading range on the daily chart, and is now at the bottom of the range. This is the buy zone, which means that the probability favors the bulls. However, in a tight range, the probabilities hover between 45 and 55%, so neither side has a big advantage.
The bulls see a double bottom on the 60 minute chart. The bears see a double top. The 1st breakout has a 50% chance of reversing. Both sides are looking for a measured move. However, most breakouts fail, and traders will continue to take relatively quick profits until there is a strong breakout. Since today went down and is at the bottom of the range, the odds are that tomorrow will have at least a couple of hours of sideways to up trading.
See the weekly update for a discussion of the price action on the weekly candlestick chart and for what to expect going into next week.
Traders can see the end of the day bar-by-bar price action report by signing up for free at BrooksPriceAction.com. I talk about the detailed S&P Emini futures price action real-time throughout the day in the BrooksPriceAction.com trading room, and a 2 day free trial is available.
When I mention time, it is USA Pacific Standard Time (the Emini day session opens at 6:30 am PST, and closes at 1:15 pm PST). You can read background information on the intraday market reports on the Intraday Market Update page.


