Likely start of Emini 5% correction after buy climax
Updated 6:45 a.m.
The Emini gapped down and is between important support and resistance. Consequently, it might test both today. The 20 day EMA below is at the 2800 Big Round Number. Yesterday’s low and last week’s low are just above. The 1st 2 bars had prominent tails. This is hesitation. The 3 day tight range above is a magnet.
All of this creates uncertainty and increases the odds of another mostly trading range day. The Emini is trying to test 2800 1st. The odds are against a strong breakout below. Yet, the 60 minute chart is probably in a bear trend. Consequently, there is an increased chance of a big bear trend day. However, the Emini opened above support and has not collapsed below. This increases the odds of a rally up from support.
While today could be a big bull trend day, the 3 day tight trading range and the open between support and resistance make a trading range day more likely. The swings will probably be big again today.
Pre-Open market analysis
The Emini is at the bottom of a 3 day tight trading range on the 60 minute chart. While a bear breakout below the range would be a lower high major trend reversal on the 60 minute chart, the selloff so far lacks consecutive big bear bars. Consequently, it is more likely that the bull trend on the daily chart will resume today or Monday.
However, the selloff is big enough to make a 2nd leg down likely. Therefore, a 2 – 5 day rally will probably form another lower high major trend reversal on the 60 minute chart. If there is a new all-time high, it will probably reverse. That would create an expanding triangle top. The odds are that a 5% correction is underway, but there might be one more new high first.
Overnight Emini Globex trading
The Emini was down 20 points in the Globex market, but reversed up from below 2800 and the 20 day EMA after the Unemployment Report. It still might gap down when the day session opens today, but the gap will be small. It would therefore probably close in the 1st hour.
Furthermore, the Emini is around last week’s low and today is a Friday. If today closes near the low of the week, and especially if it closes below last week’s low, it would totally reverse last week’s strong bull breakout. Consequently, this week would form a 2 bar reversal with last week and become a sell signal bar for next week. This would increase the odds that a move down to the 20 week exponential moving average has begun.
Because the Emini is testing the daily moving average in a strong bull trend and the selloff on the daily chart lacked big bear bars, the odds are that there will be buyers here. This means that the Emini will probably retrace half of the selloff over the next week. But, if the 60 minute chart is now in a bear trend, the bears will sell the rally. In addition, if there is a 2nd leg down, it will probably be much stronger (bigger and faster) than this week’s first leg down. This means that traders should be ready for big bear days over the next 2 weeks, even if there are big rallies along the way.
The swings up and down have been very good for day traders. There is no sign that this is about to end.
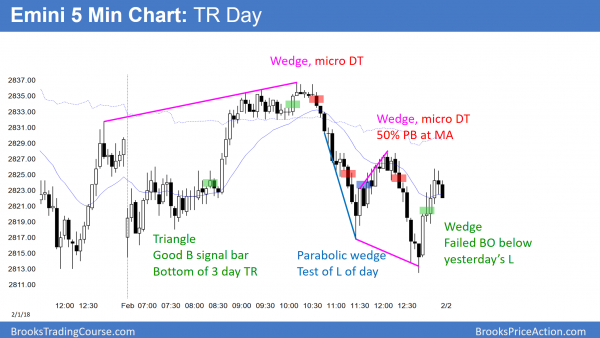
Yesterday’s setups
Here are several reasonable stop entry setups from yesterday. I sometimes also show limit order entries and entries on the close of bars.
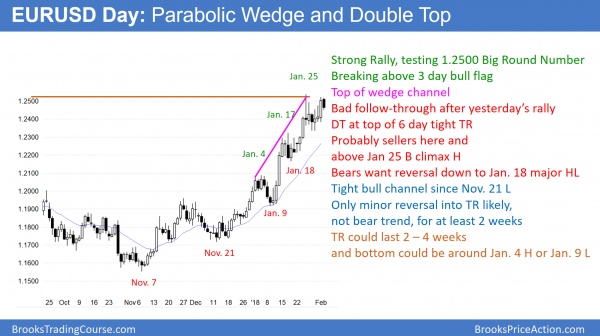
EURUSD has a double top and a parabolic wedge rally
The EURUSD daily Forex chart had a strong bull breakout yesterday, but the bull flag was weak and at the top of a parabolic wedge bull channel. The odds are that the breakout will fail and the chart will soon enter a trading range.
The EURUSD daily Forex chart has rallied strongly since November and it has been in a bull trend for more than a year. Yet, there are consecutive complex tops in the 3 month rally. The 2nd and current one is a parabolic wedge. Furthermore, it is at the top of a possible wedge bear flag on the monthly chart. Finally, the 4 day bull flag over the past week lacked strong bull bars.
These factors make a transition into a trading range likely. Consequently, despite yesterday’s strong bull trend day, the odds are that the chart will begin to turn down and form a trading range either here or from slightly above last week’s high. The 1st target for a possible bottom of the range is the bottom of the most recent buy climax. That is the January 18 low.
A trading range usually has at least 2 small legs sideways to down and lasts at least 2 – 4 weeks. Once formed, the bulls will have a bigger bull flag and the bears will have a major reversal pattern. Since the weekly chart is still in a bull trend, the odds would still favor a bull breakout. But, a trading range is a sign that the bears are about as strong as the bulls. Consequently, the more bars that get added to the range, the more the probability of a bear breakout approaches that of a bull breakout.
Overnight EURUSD Forex trading
The EURUSD 5 minute Forex chart pulled back 70 pips overnight. That is consistent with what I wrote about the daily chart. Day traders will begin to sell rallies. Until there is a strong bear breakout, bulls will buy pullbacks. Since a trading range is likely forming on the daily chart, the bulls will be no longer willing to hold for a breakout when rallies are near prior highs.
The 5 minute chart is at the top of a 7 day trading range. This is the sell zone. Traders will look for sell setups on the 60 and 240 minute charts for a test of the bottom of the range. The range is about 200 pips tall. Bulls want to buy in the lower half. Both will mostly take quick profits of about 50 pips until there is a strong buy or sell setup or until there is a strong breakout up or down.
Day traders trading the 5 minute chart will scalp as they wait for a breakout. For example, the 5 minute chart has been mostly in a 40 pip range overnight. I am writing just after the unemployment report and there is a 30 pip bear breakout. The follow-through selling so far is bad. The bears need to see more before they will swing trade.
Summary of today’s S&P Emini futures price action and what to expect tomorrow
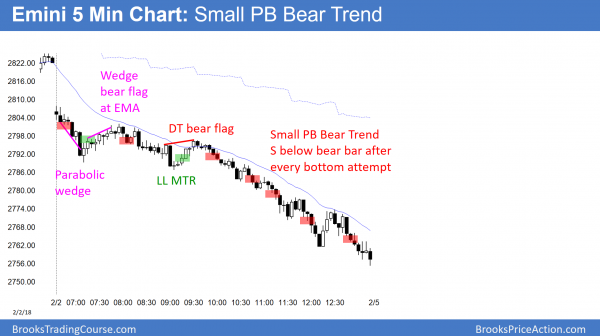
The Emini gapped down and sold off from a wedge at the moving average. In the middle of the day, it entered a small pullback bear trend.
Today was a very strong day for the bears. The Emini has now fallen 3% from the all-time high. The odds are that it will continue down for at least 5%. The minimum target is the 20 week EMA. It is currently below 2700, but it is rising rapidly.
The monthly and weekly charts are still in bull trends. This selloff will likely be a bull flag on the monthly chart, even it if falls 10% over the next 2 months.
Because today was a sell climax, there is only a 25% chance of a 2nd big bear day on Monday. In addition, there is a 75% chance of at least a 2 hour trading range that begins by the end of the 2nd hour. However, the bears will sell rallies at least until the selloff falls to the 20 week EMA.
See the weekly update for a discussion of the price action on the weekly candlestick chart and for what to expect going into next week.
Traders can see the end of the day bar-by-bar price action report by signing up for free at BrooksPriceAction.com. I talk about the detailed S&P Emini futures price action real-time throughout the day in the BrooksPriceAction.com trading room. We offer a 2 day free trial.
When I mention time, it is USA Pacific Standard Time (the Emini day session opens at 6:30 am PST, and closes at 1:15 pm PST). You can read background information on the intraday market reports on the Intraday Market Update page.


