Posted 7:05 a.m.
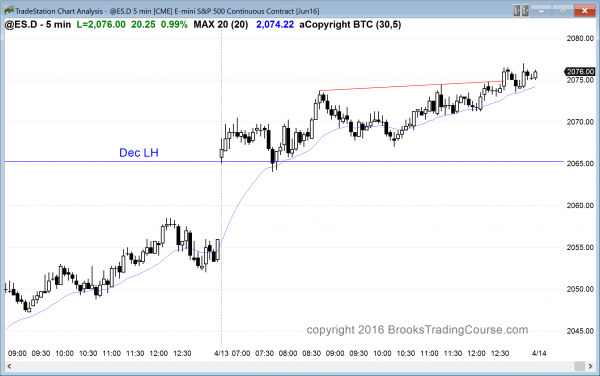
The Emini gapped up and had 3 early bull bars, but the bars overlapped and had tails. This was a weak opening for the bulls. Also, limit order bears made money twice in the 1st 5 bars. This is not how bull trends typically begin and it increases the chances of a trading range lasting an hour or two. If one continues to develop, bulls will look to buy above a bull buy signal bar at the bottom of a double bottom or wedge bottom near the moving average. Bears will look to sell below a bear sell signal bar if there is a double top or a wedge top. If there is a strong breakout up or down, swing traders will enter on closes.
This early trading range price action increases the chances for a lot of trading range price action today, and it reduces the chances that the bulls will get the strong breakout they were hoping to create. Breakouts and trends can come at any time, but the odds are now less.
Pre-Open Market Analysis
S&P 500 Emini: Learn how to trade a possible new all time high
The Emini reversed up from a breakout below the neck line of a head and shoulders top on the 60 minute chart, as it usually does. Only 40% of tops lead to reversals. On Friday, I said that reversal was big enough so that the rally would probably get above the right shoulder of the head and shoulders top, which was last Wednesday’s high of 2060.50. The Emini got close yesterday.
Near the end of the day, I said that it was so close that it might gap above it today. It is up 9 points in the Globex session and above that high. The bears put their stops above that high. As long as the Emini is forming lower highs, the bears have a chance of a bear trend. Once the Emini gets above, then the 60 minute bear trend argument is over. The Emini is either still in a trading range (it has been in a trading range on the 60 minute chart for almost a month), or back to being in a bull trend.
The daily chart still has lower highs. However, I said that it would probably rally above the December 2nd lower high and test the November 3 lower high of 2093.25. The Emini daily chart has been in a trading range for 2 years. There is a cluster of 3 lower highs in the October to December trading range, which is near the top of the 2 year range. When there is a cluster of resistance levels at the top of a trading range and a market gets above 1, it usually gets above most.
If the Emini gets above the top one, it will probably then break out to a new all-time high above 2,100. If it reversed down, which is still more likely, it will then probably enter a trading range that lasts more than a month and is about 100 points tall, like it did 4 other times in the past 2 years.
This is an interesting area on the daily chart because the behavior here has importance for the next several months. Today and tomorrow will be especially interesting. If the bulls are going to get a breakout to a new all-time high, they are strong. If they are strong, they will do things to show traders that they are strong. One thing that bulls typically do is create strong breakouts.
If today is a big bull trend bar closing on its high and tomorrow is another bull bar, especially a big one that closes far above the 2,100 all-time high, traders will conclude that the bulls are strong. They will then think that the breakout could result in a measure move up, based on the 300 point height of the past 2 year trading range.
Since the Emini is still in a trading range, the probability is against a successful breakout. If it breaks out, the odds still favor a limited breakout, a reversal down, and disappointed bulls. Also, it has not ye broken out. It still is in a trading range. When a market is in a trading range, as soon as the bulls or bears get hopeful, they are usually disappointed. This means that the odds favor that today and tomorrow will end up disappointing the bulls. They would be disappointed by the lack of strong bull trend bars. If they are disappointed, they will take partial or full profits, and the bears will sell, at least for a 1 – 5 day trade. With bulls and bears selling this rally, the odds favor a pullback over the next week or so.
This what is fun and why the next 2 days are important. They shift the probabilities, depending on how they look. The stronger the breakout attempt, the more likely there will be a new all-time high within a weak. A failed breakout or a weak breakout means that a pullback and trading range are more likely.
Online day traders should be ready for a trend day up or down. Since the Emini is in a trading range on all time frames, today will more likely not be a strong trend day. However, it has the potential to be a very big day.
Forex: Best trading strategies
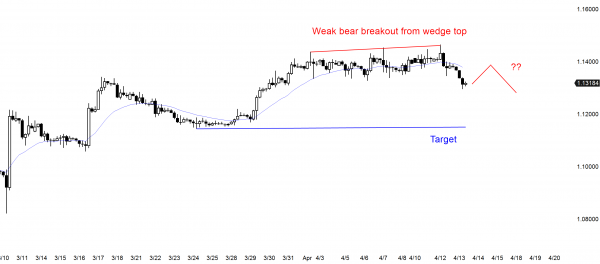
Weak breakout from weak wedge top. Probably weak bounce and weak 2nd leg down.
I said yesterday that the 60 minute chart of the EURUSD had a wedge top and that it was trying to reverse 200 pips down to test the most recent higher low. That higher low is the March 24 higher low around 1.1140. The EURUSD broke below the 8 day tight trading range last night, and it is at the support of the 20 day EMA on the daily chart, which has been support. The odds of a test down increase if today ends up as a big bear trend day that closes well below the daily moving average.
However, it is support, and the past 8 days have been doji days in a tight trading range. Most breakouts from tight trading ranges fail. This is especially true when there are a lot of dojis, which tell traders that the market thinks that the price is fair. The bears need a strong breakout today and follow-through tomorrow before traders will conclude that the price is horribly wrong. The odds are against it. Those dojis tell us that the odds are that there will be something wrong with the bear breakout and follow-through and it will disappoint the bears. While the bears might get their 200 pip selloff, it will not likely come in the form of a strong bear trend on the daily or 60 minute charts.
Look at the selloff on the 60 and 240 minute charts over the past 2 days. There is a lack of consecutive big bear bars closing on their lows. When a bear trend begins without urgency, the odds are that it will not get very far. The bears need to do much more before traders conclude that a reversal down has begun. Without more strength, this sell off will probably just increase the height of the 2 week trading range and traders will have to wait for more information before they will be willing to hold onto positions for more than a few hours.
The EURUSD 5 minute chart has been in a 30 pip tall trading range for 4 hours. The bear breakout before the range was brief. Online day traders today will continue to scalp with limit orders until there is a strong breakout up or down.
Traders trading the 240 minute chart are happy to see a breakout from the 8 day tight trading range, but are disappointed by the small bear breakout. They will take partial profits and will exit completely if the EURUSD begins to reverse up. Their stop now is just above the 1.1400 top of last night’s bear breakout, and their target is the higher low around 1.1140. They are risking about 100 pips to make 160 pips, and the probability right now is about 50%. This is an acceptable trade, but not a great trade. If the breakout becomes stronger, the probability will go up.
The odds favor a 2nd leg sideways to down after a pullback, and a pullback is likely soon.
Summary of today’s S&P Emini futures price action and what to expect tomorrow
The Emini had an opening reversal up from the December lower high and the moving average, followed by a weak bull channel.
After breaking above the right shoulder of the 60 minute head and shoulders top, the next targets are the 2 other lower highs in the October to December trading range and then the all-time high. The odds are that the Emini will at least test the 2nd of the 3 lower highs at 2086.25.
The bears want a double top lower high major trend reversal on the weekly chart, and the bulls want the new all-time high. The bear case is still slightly more likely because the Emini is at the top of a 2 year trading range and it has had many lower highs and low in the range. Markets resist change so the odds are slightly against the bull breakout, even though the odds favor at least a little more up over the next few days.
See the weekly update for a discussion of the price action on the weekly candlestick chart and for what to expect going into next week.
Traders can see the end of the day bar-by-bar price action report by signing up for free at BrooksPriceAction.com. I talk about the detailed S&P Emini futures price action real-time throughout the day in the BrooksPriceAction.com trading room, and a 2 day free trial is available.
When I mention time, it is USA Pacific Standard Time (the Emini day session opens at 6:30 am PST, and closes at 1:15 pm PST). You can read background information on the intraday market reports on the Intraday Market Update page.


