Posted 8:58 a.m.
The Emini reversed up from below yesterday’s low with a micro double bottom. The initial bars were big and there were several reversals. This is trading range price action and it increases the chances of mostly trading range price action for the 1st 2 – 3 hours.
A trend can begin at any time, but the bulls need more follow-through buying. There has only been 1 bear bar in the 1st 5 bars, and the Emini is Always In Long. However, the rally will probably end up as a bull leg in a trading range, which means that there will probably be a bear leg that starts by the end of the 2nd or 3 hour. Friday was small enough so that today could become an outside up day. However, a trading range is more likely.
It is also possible that this initial rally is a bull trap and that the Emini might be putting in an early high. However, with only 1 bear bar, and an oversold 60 minute chart, the downside is probably limited.
Pre-Open Market Analysis
S&P 500 Emini: Learn how to daytrade at support
The 60 minute chart traded down far enough from its head and shoulders top to make bulls begin to buy and bears begin to buy back shorts. It fell in 3 legs that held above the June 3 higher low, and traders see the selloff as a wedge bull flag. This will give online traders a chance to learn how to daytrade at support. The selloff created uncertainty and the result is usually a trading range. The Emini is back into its trading range of late May and early June, and with the FOMC meeting on Wednesday, it will probably be mostly sideways until then.
There is still the magnet of the all-time high in the cash index. It is only 14 points above last week’s high, and the Emini could get there this week. There probably will be sellers above the old high, as I discussed over the weekend.
Whenever enough traders believe that there will be sellers above the high, traders begin to sell below the old high, just in case the rally does not make a new high. It is impossible to know how many traders and computers will be selling below the high. If the Emini reaches a new high, there will probably be sellers up there because the Emini is still at the top of a trading range. It has not strongly broken far above the range. The bulls need that strong breakout. They have about a 40% chance of getting it before a test down to the April low.
If the Emini makes a new high, the bears will see it as another potential expanding triangle top on the daily chart. If the Emini rallies, but turns down from a lower high, the bears will see that as a lower high major trend reversal and another head and shoulders top. If the Emini trades down to the bottom of the expanding triangle at the April low, a rally from there could create a bigger head and shoulders top. The Emini could then begin to form ever larger topping patterns and ultimately fall to 1500. There is a 60% chance of that happening at some point in the next 3 years.
There is no persuasive evidence yet that the process has begun. Just like the bulls need a strong breakout above the trading range, the bears need a strong reversal down. The Emini is overbought and at resistance, and there are news events coming up. These include 2 FOMC meetings and a possible Brexit. All have the potential to start a big move. The institutions already know whether they will buy or sell. No one knows if more dollars want to sell or buy. A news event often leads to institutions acting, and we do not find out until the do.
The Emini has been in a narrow range in the Globex sessions and it is down 6 points. This is consistent with the likelihood that the Emini will be in a trading range going into Wednesday’s FOMC meeting. As always, day traders will swing trade instead of scalping if there is a strong breakout up or down.
Forex: Best trading strategies
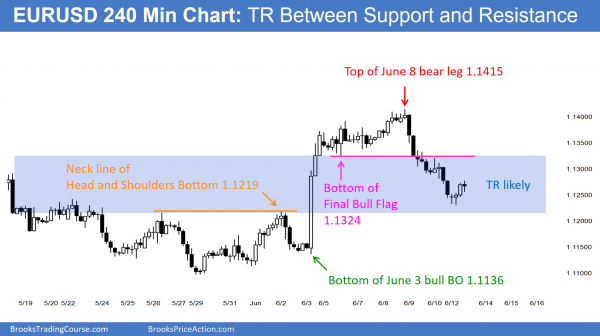
The EURUSD 240 minute Forex chart is trading between support and resistance and will probably form a trading range.
The EURUSD Forex chart is neutral on the daily chart. It had a 50% pullback from the rally to the June 9 high. That high was a 50% pullback from the selloff to the May 30 low. That low was a 50% pullback from the rally from the March 10 low. The legs are getting smaller. It is also testing the neck line of the May 26 and June 2 Head and Shoulders Bottom on the 240 minute chart at around 1.1215. Traders can call this an apex of a triangle that has been unfolding since March, or simply the middle of a 3 month trading range within a yearlong trading range.
It does not matter what traders call it. Traders see it forming a tighter and tighter range. That is a breakout mode setup and it can lead to a protracted move in either direction. The probability is slightly higher for the bears because the move that led to it was a bear trend on the weekly chart. However, after 20 or more weeks in a tight trading range, the advantage of the bulls shrinks to almost nothing. The probability of a bull breakout of the yearlong trading range is about the same as for a bear breakout.
The 60 minute chart is oversold, but it is holding above the bottom of the rally that began on March 3. The channel down is tight. The bulls will probably need a day or so of sideways trading before they can build enough buying pressure for a rally. A 50% pullback from last week’s selloff is around 1.1330. This is at the bottom of the June 8 trading range and the top of the bear channel that began on June 9.
While the selling of the past couple of days could continue a little further, the 60 minute chart is oversold, and the target above is about 50% of the way up. This makes it likely that the EURUSD will bounce going into the FOMC report on Wednesday. Less likely, the tight bear channel will continue down to below the bottom of the June 3 bull reversal without bouncing first.
The odds are that it will go sideways below the early June 60 and 240 minute trading range low around 1.1330 and above the 240 minute head and shoulders neck line around 1.1220. It has been in a 22 pip tight trading range in the European session and traders have only been scalping. There is room to the target 40 pips below. It could fall there or ever further, but the selling is probably exhausted, and a trading range for the next couple of days is more likely.
Summary of today’s S&P Emini futures price action and what to expect tomorrow
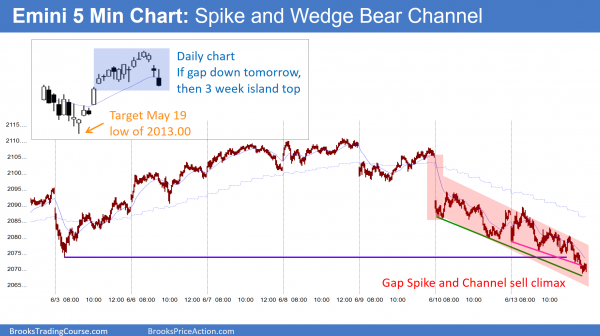
The Emini rallied in a parabolic wedge to yesterday’s close and then sold off in a broad bear channel.
After an early rally, the Emini did what was likely and had mostly trading range trading today, even though it was in a broad bear channel and bear trending trading range day.
It traded just below the bottom of the 3 week trading range. If it gaps down tomorrow, the 3 week trading range will become an island top. If the gap stays open for 2 – 3 days, that would increase the chances that the Emini has begun its 100 point pullback to the May low. Because of the upcoming FOMC and Brexit news, there can be a sudden move up or down at any time.
If the Emini does not gap down tomorrow, that would increase the chances of another trading range day. The location at the bottom of a 3 week trading range is good for the bulls. The overbought weekly chart with its buy climax is good for the bears.
The selling was in a broad bear channel. It might gap down and accelerate down tomorrow. More likely, the selling was climatic enough to have at least 2 hours of sideways to up trading that starts by the end of the 1st 2 hours. There might be a gap down and follow-through selling 1st. There is a 25% chance of a strong bear trend day tomorrow.
There is a 60% chance of a 100 point correction by the end of July, but there still might be one more new high first.
See the weekly update for a discussion of the price action on the weekly candlestick chart and for what to expect going into next week.
Traders can see the end of the day bar-by-bar price action report by signing up for free at BrooksPriceAction.com. I talk about the detailed S&P Emini futures price action real-time throughout the day in the BrooksPriceAction.com trading room, and a 2 day free trial is available.
When I mention time, it is USA Pacific Standard Time (the Emini day session opens at 6:30 am PST, and closes at 1:15 pm PST). You can read background information on the intraday market reports on the Intraday Market Update page.


