Posted 7:01 a.m.
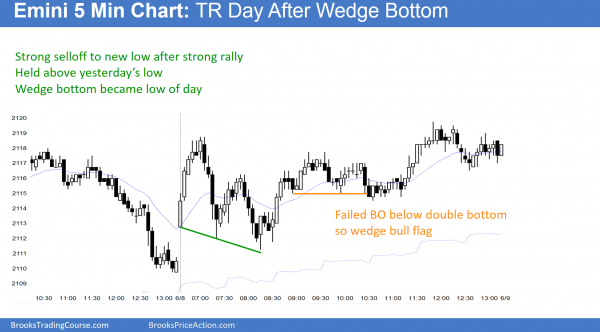
The Emini began with a Trend From the Open bull trend and a breakout above yesterday’s high. The bulls hope that this is a spike that will be followed by a channel up, forming a strong bull trend day. The bears see yesterday’s late selloff as strong. They will try to create a higher high major trend reversal. The initial rally was strong enough so that the 1st reversal down will be bought, and the best the bears can reasonably hope to get over the next 5 – 10 bars is a trading range. If a trading range forms, the reversal down can be a deep pullback, but the odds would still favor a test back up to this area after an hour or two. The bears need a strong top or a strong reversal down. They have neither. Until the get either, the odds favor sideways to up.
The bears will try to get a 2nd entry failed breakout of yesterday’s high. However, with the initial rally as strong as it is, even if that 2nd reversal becomes the high of the day, the initial selloff will probably still go mostly sideways for an hour or so before there is a strong reversal down.
Pre-Open Market Analysis
S&P 500 Emini: Learn how to day trade weak candlestick tops
Yesterday was another all-time high. More importantly, the cash index failed at its November 3 lower high, creating a possible double top lower high major trend reversal on the daily chart of the cash index. On the Emini daily chart, yesterday was a weak reversal bar because it had a doji body. The channel up from the May low is still tight. While this might prove to be the high for the next month or more, the bears have to do more. Most traders see yesterday’s reversal as minor and expect more sideways than down, and maybe more up.
Also, the cash index went above the November high instead of forming a perfect double top or a slightly lower high. This increases the chances that it will test its all-time high, which is another 15 points above yesterday’s high.
The 5 and 60 minute charts were overbought midday yesterday. This will probably result in a day or two of sideways to down trading. Unless the bears get a strong downside breakout, a trading range is more likely than a swing down on the 60 minute chart.
I have mentioned several times that there are problems with the daily, weekly, and monthly rallies (see my update yesterday), and these problems reduce the chances of a sustained breakout to a new all-time high without a pullback first. They increase the chance of a failed breakout and a correction that could last a month or more. There is a 40% chance that the current breakout will continue up without a significant correction and reach a measured move, based on the 80 point height of the 2 month trading range.
The odds are that even if the cash index reaches a new high, the lack of strength of the breakout makes it likely that there will be a 80 – 100 point pullback within the next month or two. Also, if there is a successful reversal down on the daily chart, it would be from an expanding triangle top with the April 1 and April 20 highs. If there is a strong sell signal or a strong downside breakout below the trading range of the past 2 weeks, there would be a 40 – 50% chance of a test below the bottom of the triangle. That bottom is the April low of 2022.
Forex: Best trading strategies
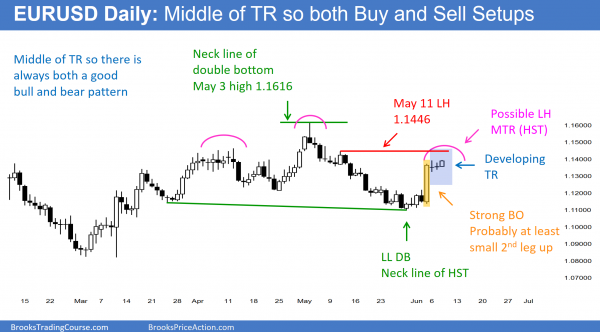
The EURUSD Forex daily chart began a small 2nd leg up overnight, but there is resistance 50 pips higher. The odds are that the rally will stall around here and then correct down 100 or more pips.
The EURUSD Forex chart had a strong bull breakout on Friday from a support level after consecutive sell climaxes on the daily chart. The rally reached the obvious targets by the end of the day. The EURUSD has traded sideways for the past 2 days. Whether it trades up or down for 100 pips over the next week, the move will probably be a leg in a developing trading range. This is a Big Down, Big Up pattern on the daily chart, and a trading range usually follows.
The daily chart has been in a trading range since the March 16 low, and within a bigger trading range for over a year. Since it is in the middle of the 3 month range, the odds are that it will test up and down for a week or two before it decides between a test of the top of the May rally or the bottom of the May selloff. The bears see last week’s rally as a right shoulder of a Head and Shoulders top. The bulls see last week’s rally as a double bottom with the March 16 low.
Since the EURUSD daily chart is in the middle of a trading range, the bulls and bears each have about a 50% chance of a successful breakout. There is not enough evidence at the moment to conclude that either side has an edge. When that is the case, sideways is the usually outcome. Bears will sell more on any small rally and take quick profits. Bulls will buy more on any small selloff, and take quick profits. This is how a trading range forms, and this will probably be what we see for at least a couple of weeks.
Last week’s reversal up was strong enough to make at least a small 2nd leg up likely. However, that would be a test up in the upper half of the 3 month range, and it probably will not get far before it attracts sellers. The bulls got a small breakout overnight above yesterday’s high. This fulfills the minimum requirement for a 2nd leg up. The bulls obviously want a test up to the May high. However, the EURUSD daily chart is in a trading range, and traders have to expect disappointment. A 2nd leg that lasts only 1 – 3 days and rallies only 50 – 100 pips is a possible example. Less likely, the 2nd leg will be very strong and test the May high without a pullback.
Since the overnight rally was weak, the odds are that it is going to be a bull leg in a developing trading range that might last a week or two, and not the start of a test of the May high. Day traders will scalp today unless the rally becomes much stronger. The next magnet is the May 11 lower high of 1.1446, which is about 50 pips above. The momentum up is strong enough so that the EURUSD Forex chart will probably get there within a few days.
If it gets there, since the 4 day rally is probably a bull leg in a trading range, the odds are that it will stall around there and then pull back 100 or more pips. A reversal down from this area will make the bears begin to thing that a lower high major trend reversal is triggering. They, like the bulls, have a 40% chance of a successful breakout over the next few weeks. More likely, the trading range will continue. The June or July Fed rate hike decision could lead to a breakout either way.
Summary of today’s S&P Emini futures price action and what to expect tomorrow
The Emini made another all-time high today. After a strong bull breakout on the open, the bulls had a weak rally from a wedge bottom.
Although the rally on the daily chart has been weak, there is no sign of a top. The cash index got to within 15 points of its all-time high, which means that the next resistance in the Emini is about 15 points higher. The odds still favor an 80 – 100 point selloff over the next month or two down to the April low at the bottom of the trading range. There is no sign of a top yet, and the Emini could continue up for another couple of weeks before it begins its test of the April low.
See the weekly update for a discussion of the price action on the weekly candlestick chart and for what to expect going into next week.
Traders can see the end of the day bar-by-bar price action report by signing up for free at BrooksPriceAction.com. I talk about the detailed S&P Emini futures price action real-time throughout the day in the BrooksPriceAction.com trading room, and a 2 day free trial is available.
When I mention time, it is USA Pacific Standard Time (the Emini day session opens at 6:30 am PST, and closes at 1:15 pm PST). You can read background information on the intraday market reports on the Intraday Market Update page.


