Holiday trading makes Dow 20,000 stronger resistance
Updated 6:55 a.m.
The Emini opened within yesterday’s tight trading range, but sold off to test yesterday’s low. Because yesterday was a sell signal bar on the daily chart, the bears see the break below yesterday’s low as a trigger for a daily sell signal.
Yet, the Emini has been in a trading range for 10 days. Therefore, there might be more buyers than sellers around yesterday’s low. Hence, today could be the opposite of yesterday. If this selloff is just a sell vacuum test of yesterday’s low, the bulls will probably need at least a micro double bottom before they can take control. The bears want this selloff to be a spike that leads to a channel.
At the moment, the Emini is Always In Short, but the selling is extreme and therefore climactic. The selloff is strong enough to make a bull trend day unlikely. Yet, it is also unsustainable. As a result, the Emini will probably enter a trading range for the next hour or more. The bears will see it as a bear flag. The bulls will probably need at least a major trend reversal before they have a chance of a swing up. While today will probably be a bear trend day, it might go mostly sideways for the rest of the day.
Pre-Open Market Analysis
Christmas week is usually the quietest week of the year. As a result, the Emini spends most of its time in tight trading ranges. Because traders cannot make money when the range is 2 points and the bars are only 2 – 3 ticks, they wait for breakouts or bigger ranges. Since yesterday was a bear reversal day, today might gap down. Yesterday would therefore become an island top. There would then probably by some follow-through selling today. Yet, until there is a breakout from the 10 day range, the odds are that it will continue to grow.
The bulls want a strong breakout above the Dow 20,000 big round number. Yet, there are several forces that will probably limit the upside this week. The stock market is far above its daily moving average and therefore expensive. It is stalling at this resistance. Big moves are unusual during Christmas week. Finally, the August high breakout point has yet to have a test.
While a strong trend up or down can come at any time, it is more likely that today will be mostly within a tight trading range. If there is a strong breakout with good follow-through, day traders will swing trade. Yet, it is more likely that most days will be small, and there will even be far fewer scalps than usual.
Time and price
Charts contain 2 variables, time and price. The Dow is testing the 20,000 big round number, which is an important price. This is happening a the end of the week, month, and year, which is an important time. As a result, the odds of a big move up or down are greater. While the momentum up make a new all-time high likely, probably this week, the weekly chart is far above its average price (the moving average). Furthermore, it will probably test the breakout point at the August high within the next few months.
Overnight Emini Globex trading
The Emini is up 5 points in the Globex market. despite yesterday’s late bear breakout, the odds still favor a test of last week’s all-time high this week. Today is the 11th day in a bull flag. Since there are fewer than 20 bars in the bull flag, the odds favor a bull breakout. Since this week is typically filled with small days, the odds are that today will also be small. Yet, most days will have at least one small swing trade. Furthermore, because of the confluence of an important time and price, there is an increased chance of a big breakout up or down.
EURUSD Forex Market Trading Strategies
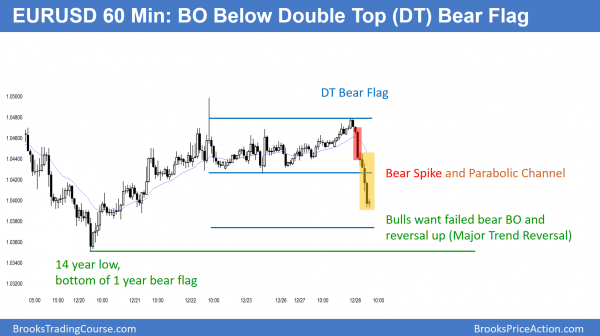
The 60 minute EURUSD Forex chart sold off strongly overnight. There was an initial big bear trend bar, which is a spike (start of a potential trend). after a couple of small bars, there was then a strong 2nd leg down. That is a potential parabolic channel. Therefore, the bulls are hoping for a base and a reversal up.
The daily EURUSD Forex chart has been in a tight trading range for 9 days. Hence, today will likely also be in a trading range. Yet, look at the monthly chart. Of the past 10 big reversals over the past 20 years, 3 began in January. As a result, traders know that the current bear breakout has an increased chance of reversing up.
Because there is no sign of a reversal, it is too early to buy. Yet, one or two big bull days, especially in early January, would be enough to make traders think that the bear breakout will fail.
Overnight EURUSD Forex trading
The EURUSD chart sold off strongly overnight. The bears want the entire selloff to be a spike leads to a bear trend. Hence, they expect the selling to continue far below the 14 year low. Yet, the bulls want a failed bear breakout. They therefore are hoping that the selling is simply a sell vacuum test of last week’s 14 year low and break below the 1 year bear flag.
The bulls need a Major Trend Reversal
While the momentum favors the bears, the bulls have a 40% chance of a major trend reversal setup around last week’s low on both the 60 minute and weekly charts. Yet, they need to stop the selling. Since the overnight selloff was strong, the bulls will need at least a micro double bottom. They therefore want the chart to go sideways for at least a few hours. If they get it, the EURUSD 60 minute chart will probably rally for 5 – 10 bars (hours) and form a bear flag. The bears therefore would expect a bear breakout and a continuation of the bear trend.
The bulls would try to get a bull breakout above the bear flag. That would therefore trigger a major trend reversal. Because major reversals only have a 40% chance of a swing up, the odds would still favor the bears. That is true until there is a very strong reversal up.
Holiday trading
Because the overnight selling was climactic, the odds favor a trading range soon. Yet, since the momentum down has been strong, bears will sell rallies. Hence, they will correctly bet on at least a little more down. Since this is Christmas week and US trading is typically slow, the odds favor a relatively small range today.
Charts are based on 2 variables, time and price. The end of the year is an important time. In addition, the 14 year low and par (1.0000) are important prices. The EURUSD is near both. As a result, there is a higher than usual chance for a strong reversal up that can last for years. Yet, the odds of this are maybe still only 20% at the moment. There is an 80% chance of either a continued trading range or a bear breakout and a test of par.
Summary of today’s S&P Emini futures price action and what to expect tomorrow
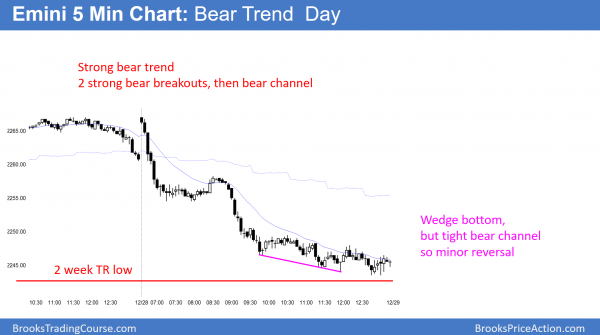
The Emini sold off from a double top with last week’s high and then traded below last week’s low. Hence, this week is an outside down week. Today was a small pullback bear trend day with 2 strong bear breakouts. It is testing the bottom of the 2 week trading range.
The Emini sold off from a 2 week double top lower high major trend reversal on the 60 minute chart today. Furthermore, it broke below last week’s low. It therefore triggered a sell signal on the weekly chart for a failed breakout above the August high. Since the breakout was strong, the odds are that this reversal down will be minor on the weekly chart. Yet, a minor reversal on the weekly chart can be 2 – 3 weeks down on the daily chart. The bears need follow-through selling tomorrow to increase the chances that a pullback has begun.
See the weekly update for a discussion of the price action on the weekly candlestick chart and for what to expect going into next week.
Traders can see the end of the day bar-by-bar price action report by signing up for free at BrooksPriceAction.com. I talk about the detailed S&P Emini futures price action real-time throughout the day in the BrooksPriceAction.com trading room. We offer a 2 day free trial.
When I mention time, it is USA Pacific Standard Time (the Emini day session opens at 6:30 am PST, and closes at 1:15 pm PST). You can read background information on the intraday market reports on the Intraday Market Update page.


