Emini weekly chart forming bull reversal bar after February low test
Updated 6:45 a.m.
The Emini opened with a big gap down. The bulls got consecutive big bull bars and an Opening Reversal up from the 60 minute EMA. The Emini is Always In Long, and these 2 bull bars make a bear trend day unlikely. That means that today will either be a bull trend day or a trading range day. The best the bears can probably get over the next hour is a bear leg in a trading range. Since the rally is still far below the EMA, the Emini will probably begin to go sideways soon. However, the odds favor sideways to up for the next 2 hours.
Pre-Open market analysis
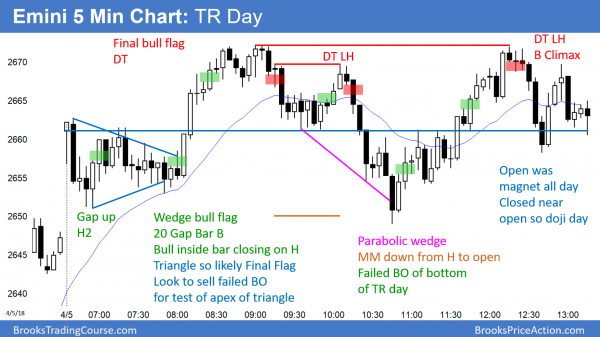
After Wednesday’s strong bull reversal, the Emini yesterday was neutral. Although the Emini gapped up, the bears closed the gap. Yesterday was a trading range day, and therefore it was weak follow-through for the bulls. This lowers the probability that the correction on the daily chart has ended. The bulls need 2 – 3 consecutive strong bull days to convince traders that the bull trend is resuming.
The bears want any rally to turn down from a double top with the March 27 high. The next few days will tell traders if the bottom is in or if this week was just a bull leg in a bear channel.
Today is the final day of the week. The week so far is a bull reversal bar on the weekly chart. It is therefore a buy signal bar for next week. Hence, the bulls want today to be a big bull day so that the bar on the weekly chart will be a strong buy signal bar. However, the bears always want the opposite. At a minimum, they want the week to close below its open of 2632. As a result, the bar would have a bear body.
Weekly support and resistance are important on Fridays, especially in the final hour. The most important magnets are the open of the week and yesterday’s high, which is the current high of the week.
Overnight Emini Globex trading
The Emini is down 20 points after the unemployment report, and did not react much to the report. It might gap below yesterday’s low. The bulls want the selloff to be a pullback from Wednesday’s strong rally. The bears want today to be an entry bar on the daily chart for a double top at the moving average with the March 27 high. The reversals every few days are disappointing to bull and bear trend traders. Therefore, a continued trading range on the daily chart is likely.
The bulls want a rally to close the gap down. The bears want the gap to stay open and be the start of a big bear day. A big gap increases the chance of a big trend. However, the 10 day tight trading range increases the chance of another mostly trading range day. When there is no clear advantage for the bulls or bear, traders should be open to anything. Fortunately, even if today is a trading range day, the legs will probably be big enough to swing trade.
Yesterday’s setups
Here are several reasonable stop entry setups from yesterday. I sometimes also show limit order entries and entries on the close of bars.
EURUSD testing bottom of 4 month trading range
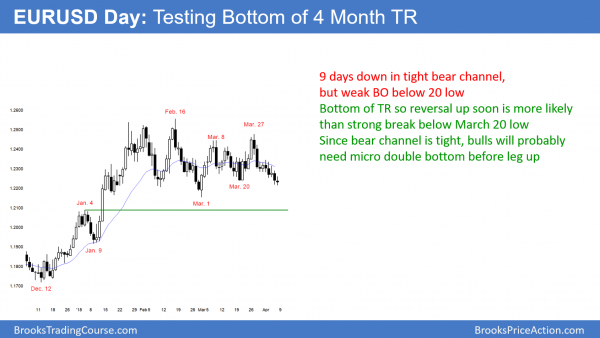
The EURUSD daily Forex chart has sold off in a tight bear channel for 9 days. It is testing the bottom of a 4 month trading range. Therefore, a reversal up next week is more likely than a successful breakout below.
The EURUSD daily Forex chart has sold off for 9 days in a tight bear channel. Yet, the past 6 days have been small and mostly sideways. This is not how a bear trend typically looks. The selloff is therefore more likely another bear leg in the 4 month trading range. The bears need consecutive big bear bars closing below the March 1 bottom of the range before traders will conclude that the trading range has become a bear trend.
Since the 9 day bear channel is tight, the bulls will probably need at least a micro double bottom before they can get a leg up. That will require a few sideways days.
Overnight EURUSD Forex trading
The EURUSD 5 minute Forex chart has been in a 30 pip range overnight. This morning’s unemployment report did not yet result in a big breakout up or down. If it does, traders will switch from scalping to swing trading.
Summary of today’s S&P Emini futures price action and what to expect tomorrow
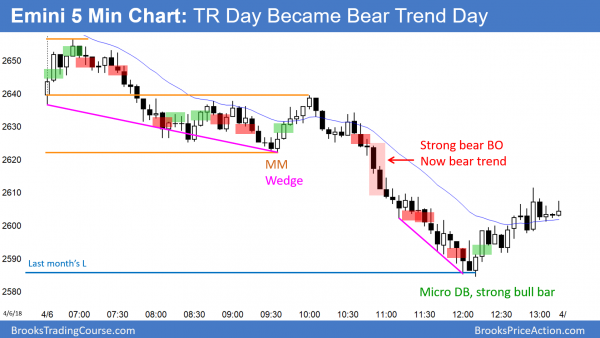
The Emini sold off after an early rally and then entered a trading range. The bears got trend resumption down. The bulls bought again at last months low, creating a rally into the close.
The Emini had a bear trend resumption down day today. The bulls bought a test of last month’s low, creating a late rally. March was a sell signal bar on the monthly chart. The Emini triggered the sell last week, but reversed back up. Today triggered the sell again, and again the bulls bought.
However, the day was still a big bear day, and the daily chart is still in its 10 day tight trading range. When in a tight trading range, the probability of the breakout averages about the same for the bulls and bears. After a big selloff like today, the odds slightly favor the bears. The odds will go back to 50-50 if next week reverses back up.
See the weekly update for a discussion of the price action on the weekly candlestick chart and for what to expect going into next week.
Traders can see the end of the day bar-by-bar price action report by signing up for free at BrooksPriceAction.com. I talk about the detailed S&P Emini futures price action real-time throughout the day in the BrooksPriceAction.com trading room. We offer a 2 day free trial.
When I mention time, it is USA Pacific Standard Time (the Emini day session opens at 6:30 am PST, and closes at 1:15 pm PST). You can read background information on the intraday market reports on the Intraday Market Update page.


