Emini wedge top and Trump tax cuts and tax reform
Updated 6:41 a.m.
Today opened in yesterday’s 4 hour trading range, just above yesterday’s low. The odds are that today will test both yesterday’s low and high. It therefore will probably have both a leg down and up and form a trading range day. Since it is close to the low, the 1st leg will probably be down. Because yesterday is a bad sell signal bar for the wedge on the daily chart, the odds are that there will be more buyers than sellers below yesterday’s low.
Any day can become a trend day up or down. If there are consecutive big trend bars up or down, traders will swing trade part of their position. Until then, traders will mostly scalp. Furthermore, if today spends a lot of time in tight trading ranges, many scalpers will enter mostly with limit orders.
Pre-Open market analysis
The Emini has a wedge top on the daily chart and buy climaxes on the daily, weekly and monthly charts. The odds are against much higher prices until after a 5% pullback. Yet, bull trends are constantly forming tops, and 80% fail. The bears need a sell signal and a consecutive big bear days.
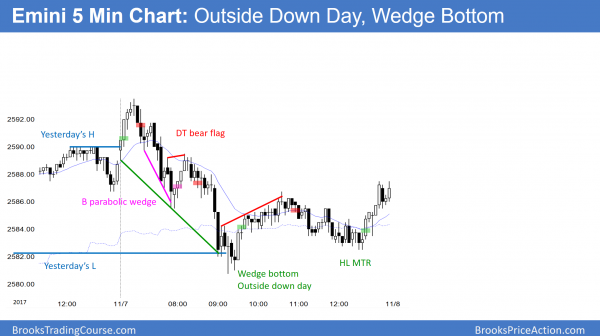
Yesterday, the Emini reversed down from a new all-time high to below Monday’s low. That created an outside down day yesterday. Since it did not close on its low, it is a lower probability sell signal bar for today. Yet, if today is a big bear day, especially if there is a big gap down, traders will begin to think that a 5% correction is underway.
Overnight Emini Globex trading
The Emini is down 1 point in the Globex session. Yesterday was in a trading range for 4 hours and today will probably begin in that range.
Furthermore, yesterday was an outside day and a doji day. That increases the odds that today will mostly overlap yesterday’s range. Since yesterday was a big day and today will open in its middle third, there is an increased chance that today will be an inside day. That means traders will buy around yesterday’s low and sell around its high. While a big trend can begin at any time, the odds favor a lot of trading range trading today.
Yesterday’s setups
Here are several reasonable stop entry setups from yesterday. I sometimes also show limit order entries and entries on the close of bars.
EURUSD Forex market trading strategies
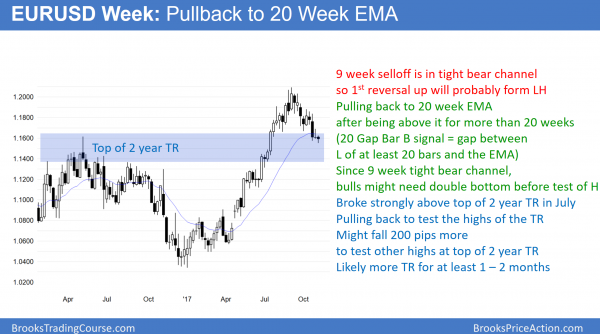
The weekly EURUSD Forex chart rallied strongly for 9 months and has pulled back to its 20 week exponential moving average. It broke above a 2 year trading range and is pulling back to test the highs of that range.
The weekly EURUSD Forex chart is in a 9 week tight bear channel at the 20 week EMA. A bear channel is a bull flag, and it now at the support of the EMA and the breakout point at the top of a 2 year trading range.
There was a gap between the low of every bar and the average for more than 20 bars. That is a sign of a strong bull trend. The bulls are now finally getting to buy at the average price instead of above it. This is a 20 Gap Bar Buy signal.
Reversals from tight channels are usually minor
Since the 9 week bear channel is tight, the bulls will probably need a double bottom before they will be able to test the high. This means that the 1st rally up from the EMA will probably fail and form a lower high. If the bulls are able to stop the selling a 2nd time around the current price, they would create a double bottom. That would have a better chance of leading to a test of the high.
The bears want a bear trend. Yet, the 9 month rally was in a tight bull channel. This reversal down is therefore probably minor. That means this selloff is either a bull flag or a bear leg in what will be a trading range. While the selloff could fall 50% down to around the July 5 low, the bulls will probably get at least a 300 pip bounce 1st.
Overnight EURUSD Forex trading
The 5 minute chart has had small sideways days for 9 days. It has been in a 30 pip range for the past 5 hours. There is no sign of a breakout. Hence, the odds favor more tight trading range trading today. Day traders will continue to scalp.
Summary of today’s S&P Emini futures price action and what to expect tomorrow
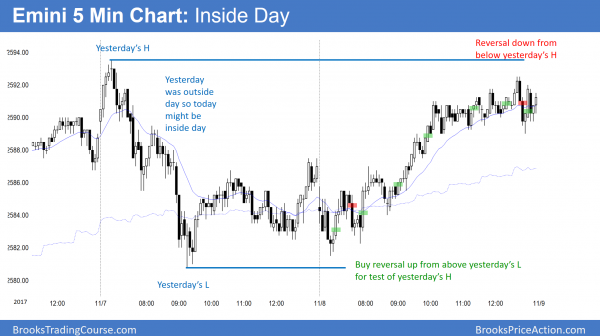
Today opened near yesterday’s low, sold off to test the low, and then rallied. It was a small pullback bull trend day, a trending trading range day, and an inside day.
Today was predictable. It sold off to test yesterday’s low and reversed up. It failed to get above yesterday’s high and therefore formed an inside day. It is an inside day after an outside day and therefore an ioi breakout mode setup. The bulls see today as a High 1 bull flag since it is a pullback in a bull channel. The bears see the bull channel as a wedge top. Today is therefore a sell signal bar. Despite the buy climaxes on the daily, weekly, and monthly charts, the odds still favor higher prices until there is a strong reversal down.
See the weekly update for a discussion of the price action on the weekly candlestick chart and for what to expect going into next week.
Traders can see the end of the day bar-by-bar price action report by signing up for free at BrooksPriceAction.com. I talk about the detailed S&P Emini futures price action real-time throughout the day in the BrooksPriceAction.com trading room. We offer a 2 day free trial.
When I mention time, it is USA Pacific Standard Time (the Emini day session opens at 6:30 am PST, and closes at 1:15 pm PST). You can read background information on the intraday market reports on the Intraday Market Update page.


