Trading Update: Monday June 14, 2021
Emini pre-open market analysis
Emini daily chart
- Thursday closed above the May 7 high, which is the Breakout Point at the top of a 2-month trading range.
- Friday had a small bull body, so consecutive bull bars with closes above that high. That increases chance for a 200-point measured move.
- Since both bull bars were small, this is a weak follow-through breakout so far.
- While it increases the chance of higher prices, it reduces the chance that the breakout will reach a 200-point measured move up. Bulls need bigger bull bars this week, to convince traders that the breakout will succeed.
- Friday was a doji inside day after Thursday’s new all-time high. As a doji bar, it is both a weak sell signal bar, for a failed breakout and a weak High 1 buy signal bar.
- Weak buy and sell signals create confusion and increases the chance of sideways trading for a few days.
- Until there is a strong reversal down, traders will continue to buy every brief selloff, as they have been doing for a year. A strong trend is always more likely to get another new high than reverse into a bear trend.
Overnight Emini Globex trading on 5-minute chart
- Up 1 point in the Globex session.
- Day traders are still deciding whether last week’s small breakout will succeed or fail.
- Since at the top of 2-month trading range, increased chance of big trend day in either direction.
- After several weeks with at least one reversal every day, day traders will expect at least one reversal again today.
- But if there is a series of strong trend bars in either direction on the open, day traders will begin to bet on a big trend day.
Friday’s Emini setups


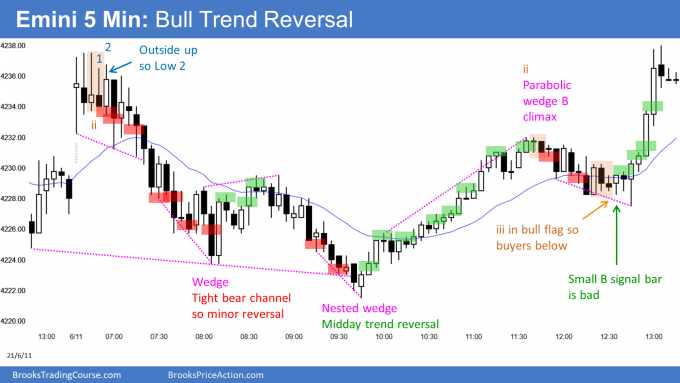
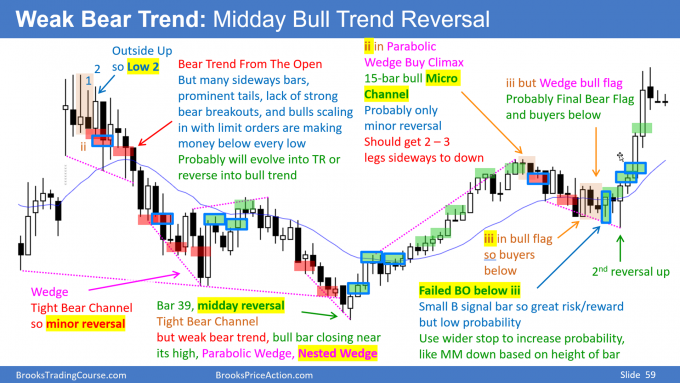
Here are several reasonable stop entry setups from Friday. I show each buy entry with a green rectangle and each sell entry with a red rectangle. Buyers of both the Brooks Trading Course and Encyclopedia of Chart Patterns have access to a much more detailed explanation of the swing trades for each day (see Online Course/BTC Daily Setups).
My goal with these charts is to present an Always In perspective. If a trader was trying to be Always In or nearly Always In a position all day, and he was not currently in the market, these entries would be logical times for him to enter.
If the risk is too big for your account, you should wait for trades with less risk or trade an alternative market like the Micro Emini.
EURUSD Forex market trading strategies
EURUSD Forex daily chart

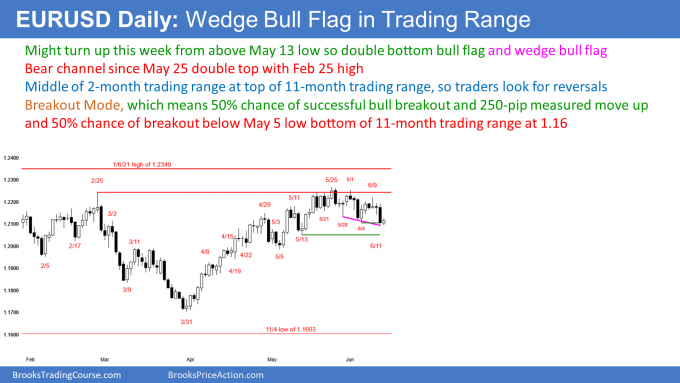
- Small bull day so far today.
- Double bottom bull flag with June 4 low, since 3-week selloff is still a pullback from rally that began on May 13.
- Also wedge bull flag.
- Bulls want bull bar today, to increase chance off a couple legs up over the next couple weeks.
- Bears want bear bar today, to increase chance of break below May 13 low, and test of bottom of 2-month trading range at May 13 or May 5 low.
- In trading range, reversals are always more likely than successful breakouts.
- Even if bears get break below May 5 low, reversal up will be more likely than measured move down.
Overnight EURUSD Forex trading on 5-minute chart
- Small trading range and inside bar (low above Friday’s low) so far today.
- Day traders have only been scalping.
- Bears want trading range to be bear flag after Friday’s big bear trend. They therefore want trend resumption down.
- Bulls hope Friday was just sell vacuum test of support at June 4 low. They want a successful test and for EURUSD now to turn up and test May 25 high again.
- The minimum that the bears want is a bear body today on the daily chart. That would confirm Friday’s breakout below the June 4 low, and increase the chance of lower prices this week.
- The minimum that the bulls want is a bull body. Today would then be a buy signal bar on the daily chart for a failed breakout.
- Today could remain small all down, with day traders continuing to scalp up and down.
- It is still possible for a series of strong trend bars, up or down, and a trend.
- However, it is becoming more likely that today will remain small, and that traders will bet that breakouts will fail. They have been focused on how the day will close relative to the open.
Summary of today’s S&P Emini futures price action and what to expect tomorrow
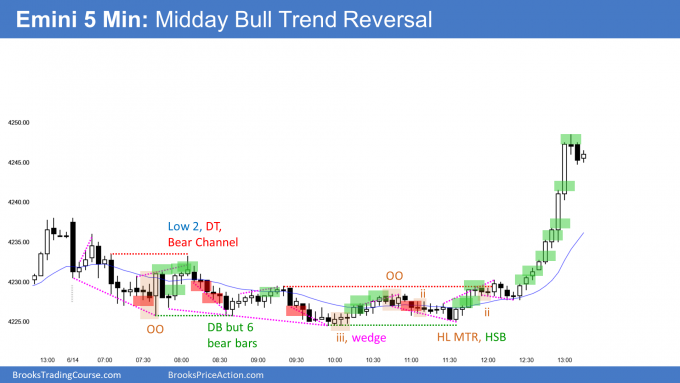
- Sold off in weak Bear Trend From The Open for the 1st half of the day.
- Strong midday reversal up to new all-time high from wedge bottom at 60-minute EMA.
- Closed near high of day so increased chance of sideways to up tomorrow. Might gap up to new all-time high.
- Since buy climax, probably will have at least a couple hours of sideways to down trading that begins by end of 2nd hour.
- Might enter trading range tomorrow ahead of Wednesday’s 11 am PT FOMC announcement.

Here are several reasonable stop entry setups for today. I show each buy entry with a green rectangle and each sell entry with a red rectangle. Buyers of both the Brooks Trading Course and Encyclopedia of Chart Patterns have access to a much more detailed explanation of the swing trades for each day (see Online Course/BTC Daily Setups).
My goal with these charts is to present an Always In perspective. If a trader was trying to be Always In or nearly Always In a position all day, and he was not currently in the market, these entries would be logical times for him to enter.
If the risk is too big for your account, you should wait for trades with less risk or trade an alternative market like the Micro Emini.
End of day summary
- I will update at the end of the day.
See the weekly update for a discussion of the price action on the weekly chart and for what to expect going into next week.
Trading Room
Traders can see the end of the day bar-by-bar price action report by signing up for free at BrooksPriceAction.com. I talk about the detailed S&P Emini futures price action real-time throughout the day in the BrooksPriceAction.com trading room. We offer a 2 day free trial.
Charts use Pacific Time
When I mention time, it is USA Pacific Time (the Emini day session opens at 6:30 am PT, and closes at 1:15 pm PT). You can read background information on the intraday market reports on the Market Update page.

